Next: Open, Close and Rewind Up: UV Data Sets Previous: UV Data Sets
The Miriad uv data structure required a more general structure. Unfortunately this is more complicated and somewhat cumbersome for simple cases. A uv data set can be viewed as an ordered (generally time ordered) stream of named records or ``variables''. There are markers in this data stream, to indicate when several variables change ``simultaneously'' (i.e. they correspond to the same time). Each variable consists of an array of values, the type of which can be either integer, real or double precision, etc. Correlation data, u and v coordinates, time and baseline numbers are specific examples of variables. Because of the special nature of these variables, special routines are available to simplify accessing them. A list of the variables that may be present in a uv data set is given in Appendix I.
In addition to this variable stream, a uv file will contain a file giving flagging information.
It should be noted that ``variables'' and ``items'' are quite distinct. For a particular data set, variables vary, or at least may vary, whereas data items are fixed. The notion of variables is unique to uv data sets, whereas all Miriad data sets are composed of data items. The stream of uv variables is implemented as three data items, called visdata, vartable and flags.
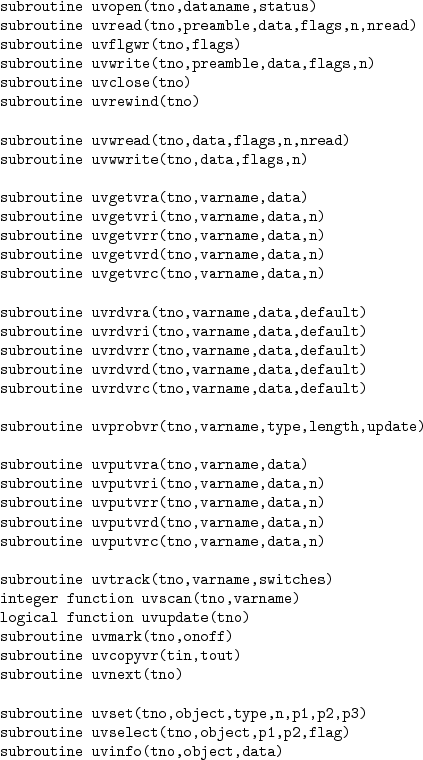
There is a ``miriad'' of uv routines.
The routines used to access and manipulate a uv data set are given in the
following table.
Miriad manager