Multi-transition OH maser observations with the ATCA
The potential of masers to act as probes of their environment has long been recognised, but to date has proven very difficult to realise. While models of maser excitation have successfully accounted for the existence of masers in the transitions observed, the number of model parameters and non-linear effects of optical depth make it difficult to draw quantitative conclusions from data on a single maser line. However, where several maser lines are observed from the same molecule at the same site, multi-transition analysis provides a means of inferring physical conditions by fitting a model of the molecular excitation to the data. This is commonly done for studies of thermal centimetre and millimetre lines, but is more difficult to achieve for masers, and has previously only been undertaken for OH masers in a single source (Cesaroni & Walmsley 1991). We have recently made the first applications of this technique to observations of class II methanol masers (Cragg et al. 2001, Sutton et al. 2001). Masers are variable on timescales of weeks to months and one of the major limitations in previous attempts at multi-transition analysis has been the uncertainties introduced by combining observations made over many years using a variety of instruments with differing spectral and spatial resolutions and polarisation properties.
The excellent frequency coverage of the ATCA means that it is able to observe transitions within all 5 OH rotational energy levels with frequencies less than 10 GHz, a total of 19 different transitions. Combining this with the ATCA frequency agility means that it is possible to observe all of these transitions within one or two observing sessions. As this is shorter than the variability timescale the observations are simultaneous from the point of view of multi-transitional modelling. Making all the observations with a single high-resolution instrument further reduces potential sources of uncertainty. We used this technique to make sensitive, high spatial resolution, full polarisation observations of 19 OH transitions towards two southern star forming regions over the course of two 12 hour sessions. Figure 1 demonstrates that for the left and right circularly polarised spectra there is often relatively poor correspondence between the velocity of the two hands of polarisation and also between different transitions. This arises because the OH molecule is diamagnetic, which leads to significant Zeeman splitting in the presence of magnetic fields. Pairs of maser lines of orthogonal hands of circular polarisation with different velocities and intensities emanate from the same spatial location. The magnitude of the Zeeman splitting differs between transitions even within the same rotational level and this significantly complicates the comparison of OH maser spectra from multiple transitions. The only exception is the 4765-MHz transition, which due to the interaction of the nuclear and electronic spins is paramagnetic and hence doesn't undergo significant Zeeman splitting in interstellar strength magnetic fields.
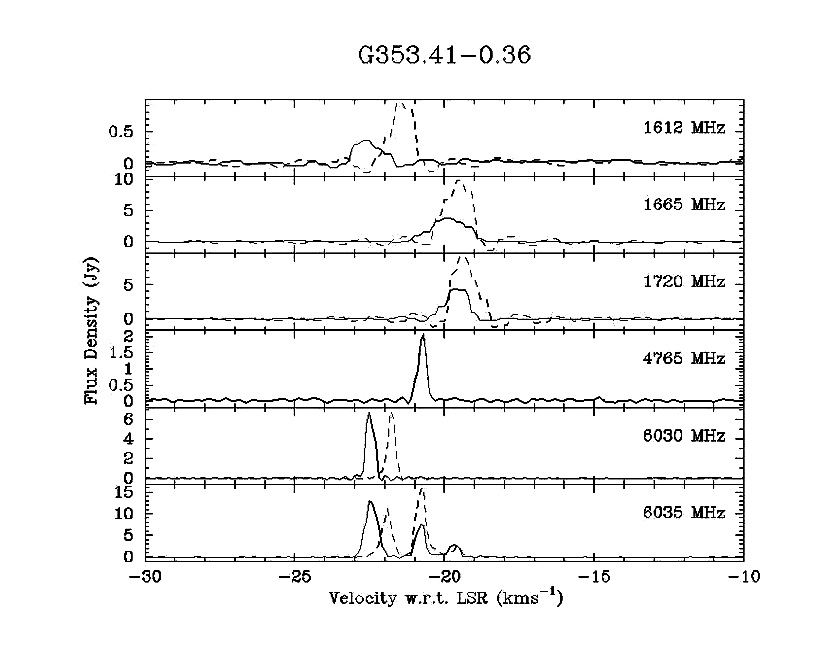
Figure 1: ATCA RCP (solid) and LCP (dashed) spectra for the 6 OH maser transitions detected towards G353.41-0.36
The only way in which Zeeman pairs can be identified directly is through VLBI observations of orthogonal circular polarisations. However, if the different transitions arise from the same general region then the magnetic field strength will be the same for all. The magnitude of the splitting is less for excited state transitions (such as those at 6030 and 6035 MHz) and this makes identification of left and right circularly polarised Zeeman pairs easier. The magnetic field estimated from these transitions can then be used to calculate the velocity correction for all other transitions and if the estimate is correct then it consistently produces convincing Zeeman pairs and velocity alignment between different transitions. Applying this technique to observations of the source G353.41-0.36 we found that the Zeeman splitting cannot be explained by a single magnetic field strength for all transitions, confirming the findings of Caswell (2001). The 1665, 1720, 4765 and 6035-MHz (-21 kms-1) masers arise in a -1.1 mG field, while the 1612, 6030 and 6035-MHz (-22 kms-1) are consistent with a -9.0 mG field (see Figure 2). This implies that although all 6 transitions are coincident within 1 arcsecond, OH masers in this region arise in two (or more) separate locations. The different combinations of maser lines detected suggest that they develop under different physical conditions.
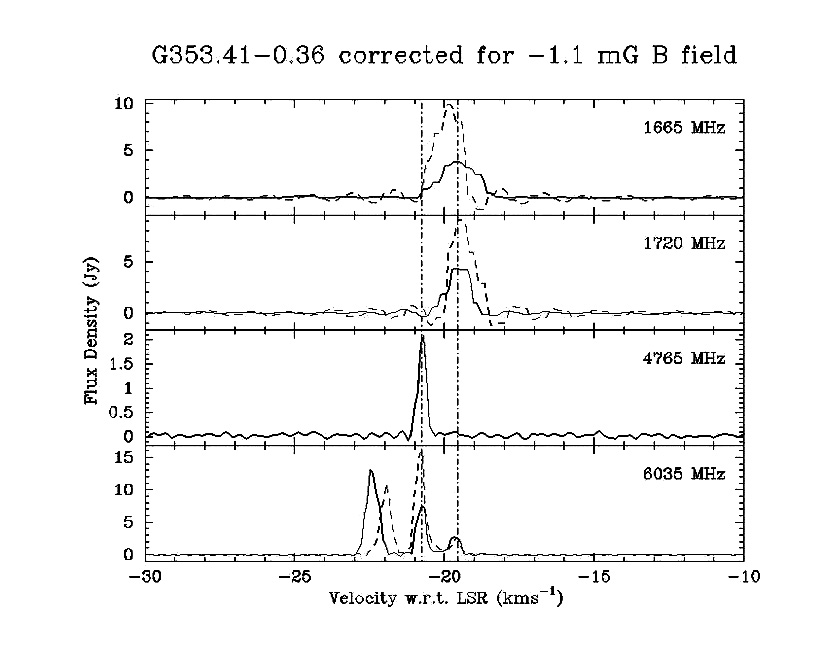
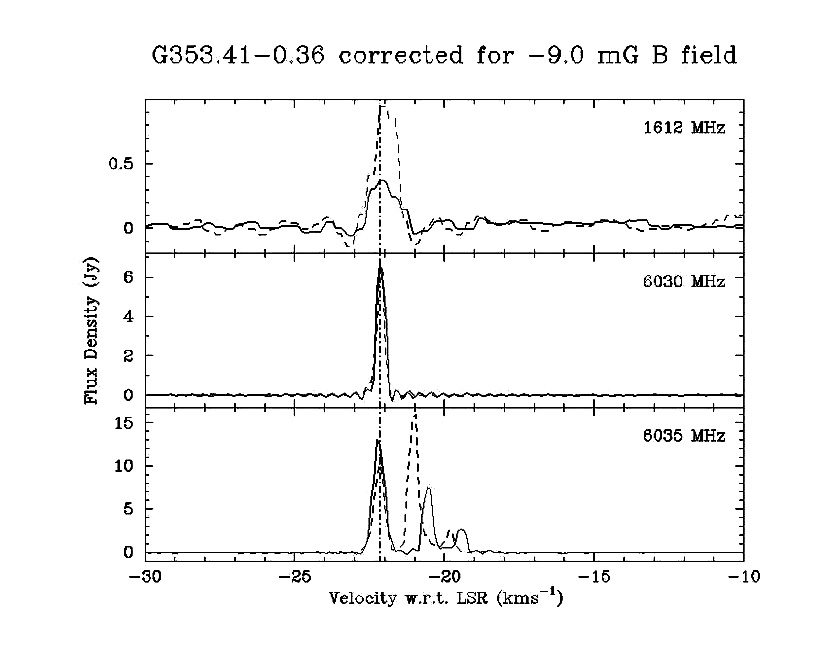
Figure 2 : The RCP (solid) and LCP (dashed) spectra of the two groups of OH masers in G353.41-0.36, after the velocities have been corrected for the effects of Zeeman splitting. The vertical lines show the velocities of spectral features which align between different transitions.
Our results suggest that we can use ATCA observations to robustly identify Zeeman pairs in multi-transitional observations. Where there is good post-Zeeman correction velocity alignment and identical magnetic field strength for two or more transitions the natural implication is that the masers spots are coincident. The only alternative method for determining this is through full-polarisation phase referenced VLBI observations for each transition. We are currently in the process of interpreting these multi-transitional OH data in the context of the theoretical model of Cragg, Sobolev & Godfrey (2002). This modelling utilises not only the information derived from the six detected OH maser transitions, but also the upper limits obtained from the 13 transitions where no emission was detected. In the model the combination of maser lines present is sensitive to the physical conditions such as gas temperature and density, dust temperature and OH abundance.
The main limitation on these observations is the spectral resolution of the ATCA correlator at low frequencies. Ideally we would like 0.1 kms-1 velocity resolution and full polarisation information for all transitions. Currently the best velocity resolution which can be achieved with full polarisation for the 1.6-GHz transitions is 0.7 kms-1 and it is this which leads to the "ringing" which is visible in the 1612, 1665 & 1720-MHz spectra. The 2-GHz correlator, to be built with funding from MNRF-II will overcome this limitation and in conjunction with the MNRF-I frequency upgrade will enable unprecedented ability to collect quasi-simultaneous, high spatial and spectral resolution full polarisation spectra of many OH (and methanol) maser transitions.
References
Caswell, J.L., 2001, MNRAS, 326, 805
Cesaroni, R., Walmsley, C.M., 1991, ApJ, 241, 357
Cragg, D.M., Sobolev, A.M., Ellingsen, S.P., Caswell, J.L., Godfrey, P.D., Salii, S.V., Dodson, R.G., 2001, MNRAS, 323, 929
Cragg, D.M., Sobolev, A.M., Godfrey, P.D., 2002, MNRAS in press.
Sutton, E.C., Sobolev, A.M., Ellingsen, S.P., Cragg, D.M., Mehringer, D.M., Ostrovskii, A.B., Godfrey, P.D., 2001, ApJ, 554, 173
Simon Ellingsen (Simon.Ellingsen@utas.edu.au), Richard Dodson (Richard.Dodson@utas.edu.au), Dinah Cragg (Dinah.Cragg@sci.monash.edu.au) & Peter Godfrey (P.Godfrey@sci.monash.edu.au)