New Class-I methanol masers at 104.3 GHz and 9.9 GHz
The methanol molecule has a large number of maser transitions that can be observed with existing radio telescopes. Approximately 500 methanol maser sites are known in regions of massive star formation in the Galaxy. Interestingly, the behavior of different transitions is not the same. One group of transitions, the so-called Class-I methanol masers, is not associated with infrared sources and ultra-compact HII regions, while another group, the Class-II methanol masers, tends to be associated with them (Menten 1991).
The observed maser transitions for E-methanol (A- and E-methanol species have different spin orientations of hydrogen atoms) are shown on the energy level diagram in Figure 1. The sets of levels for different quantum numbers K are seen as "ladders" in this diagram. The Class-I maser transitions occur from the ladder with K = -1 to K = -2, from K = -1 to K = 0, and from K = 2 to K = 1, while the Class-II transitions occur from the ladder with K = -2 to K = -1, from K = 0 to K = -1, and from K = 1 to K = 0.
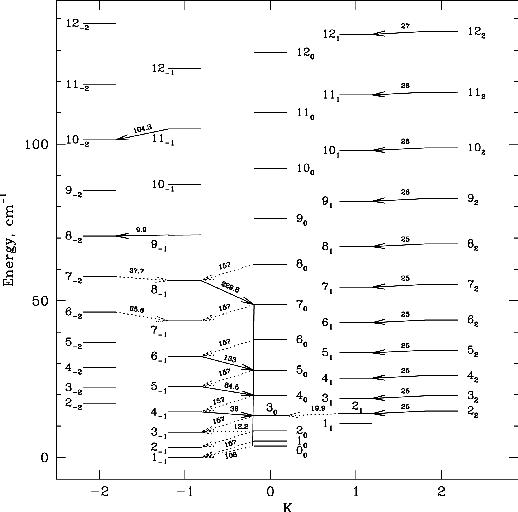 Figure 1: The E-methanol energy level diagram. Solid arrows represent known Class-I maser transitions, dotted ones represent known Class-II maser transitions. The numbers near each transition are their frequencies in GHz.
Theoretical calculations (e.g. Cragg et al., 1992; Voronkov 1999) have shown that an excess of collisional transitions (for example in a region of gas excited by an outflow, but away from the protostar) will lead to an over-population of the K = -1 and K = 2 ladders with respect to adjacent ladders, and so to the formation of the Class-I masers. Similarly, an excess of radiative transitions (as near an infrared source) under-populates the K = -1 ladder and over-populates the K = 1 ladder, switching on the Class-II masers. Note, that there are transitions of both classes between the ladders with K = 0 and K = -1, as well as between K = -1 and K = -2, but they occur in the opposite directions on the diagram. Such transitions should not co-exist in the same region of space as they require mutually exclusive physical conditions. However, a co-existence of transitions of different classes occurring between different ladders or belonging to different species of the methanol molecule may be realised in some cases. This is a subject of the ongoing theoretical and observational research (Voronkov et al., 2004).
Another problem which is still unsolved is to create an accurate quantitative model of the Class-I masers. Flux density predictions provided by existing models of these masers are very crude and do not allow one to get a reliable estimate of the physical conditions. To put useful constraints on the maser model, simultaneous observations of many maser lines are required. The Compact Array will play a significant role in this research because many Class-I methanol maser lines fall into an observable frequency range. When completed, this study will provide an indirect measurement of the physical conditions such as the temperature and density in the regions of interaction between outflows and the ambient material, which the Class-I methanol masers are believed to be associated with. A difficulty however, is that bright masers in some transitions are rather rare, and a preliminary search is required to choose good targets for studying multiple transitions. Only one narrow-line maser was known before the present study, with detections at both 104.3 GHz (Voronkov et al., 2004) and 9.9 GHz (Slysh et al., 1993) despite a comprehensive search at 104.3 GHz conducted in the Northern Hemisphere. In contrast, there are almost a hundred known sources at 44 GHz.
For a multi-transitional study it is reasonable to start with sources that have been detected in as many maser transitions as possible. However, some transitions, especially if their fluxes correlate with each other, may not add new information and, hence, a new constraint. In general, such correlations may be expected for transitions that belong to the same series. Therefore, the properties of different transitions should be examined carefully on the same sample of sources.
We have used the ATNF Mopra antenna to search for the 104.3-GHz masers towards the 44-GHz Class-I masers found in the Parkes survey (Slysh et al., 1994) with a typical detection limit of a few Jansky. Narrow-line maser emission was detected towards G305.21+0.21, G343.12-0.06 and W33-Met, the only previously known source. Their spectra are shown in Figure 2. We also detected broad-line emission from G327.29-0.58, G351.41+0.64 and G351.78-0.54 and marginal detections from five sources, G0.54-0.85, G14.33-0.64, G328.809+0.63, G344.23-0.57 and G345.00-0.22.
In follow-up observations, we have recently found that the Compact Array has a reasonable sensitivity at 9.9 GHz (except antenna 1), although this frequency is beyond the nominal frequency range of 8.0 to 9.2 GHz. We have used the Compact Array for 9.9-GHz observations of the sources with definite maser detections at 104.3 GHz. The 9.9-GHz spectra are also shown in Figure 2.
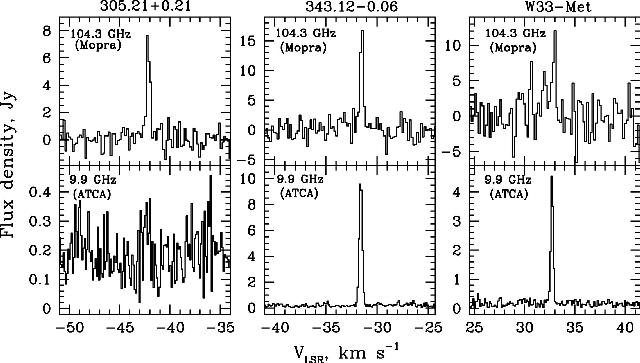 Figure 2: The 104.3-GHz and 9.9-GHz spectra of the new detections and W33-Met, the only previously known narrow-line maser at these frequencies.
For G343.12-0.06, the uv-coverage of the Compact Array observations was good enough to construct an image showing a point source at RA (2000) = 16:58:16.57 and Dec (2000) = -42:52:24. In contrast, W33-Met has a complex spatial structure at 9.9 GHz despite a simple spectrum. The current uv-coverage is not sufficient to construct a reliable image. A complex spatial structure is consistent with the 104.3-GHz and 9.9-GHz spectra of W33-Met (Figure 2), which have emission peaks at different velocities. For G305.21+0.21, the 9.9-GHz line was not detected at a significant level with the Compact Array.
A comparison of the 9.9-GHz and 104.3-GHz spectra brought some surprises. First, the flux ratio changes significantly despite the fact that these two masers belong to the same transition series J-1-(J-1)-2E. Numerical simulations are required to understand which parameters this flux ratio is sensitive to. In contrast to this pair, the fluxes of the 44-GHz and 95-GHz A-methanol transitions, which are widespread and belong to another series, J0-(J-1)1A+, are known to be correlated (Val'tts et al. 2000). This makes one of them redundant for determination of the physical conditions. Second, the 104.3-GHz line (J = 11) appears to be brighter than the 9.9-GHz line (J = 9), which has a lower excitation energy. This shows that even within the same ladder the population distribution is far from the equilibrium, and, hence, should depend on the pumping mechanism. This, together with the relative rareness of these lines makes the J-1-(J-1)-2E series a promising tool to diagnose maser pumping.
References
Cragg D.M., Johns K.P., Godfrey P.D., Brown R.D., 1992, MNRAS, 259, 203
Menten K.M., 1991, in Proc. of the Third Haystack Observatory Meeting, eds. Haschick A.D., Ho P.T.P., 119
Slysh V.I., Kalenskii S.V., Val'tts I.E., 1993, ApJ, 413, 133
Slysh V.I., Kalenskii S.V., Val'tts I.E., Otrupcek R., 1994, MNRAS, 268, 464
Val'tts I.E., Ellingsen S.P., Slysh V.I., Kalenskii S.V., Otrupcek R., Larionov G.M., 2000, MNRAS, 317, 315
Voronkov M.A., 1999, Astron. Letters., 25, 149, astro-ph/0008476
Voronkov M., Sobolev A., Ellingsen S., Ostrovskii A., Alakoz A., 2004, ApSS, proc. of the European Workshop on Astronomical Molecules, 17-20 February 2004, Zwolle, The Netherlands, eds. Hagiwara Y. et. al., in press; astro-ph/0407275
Maxim Voronkov (ATNF)
Maxim.Voronkov@csiro.au)