Narrabri atmospheric seeing monitor
In time for the start of the new millimetre observing season with the Compact Array's new 3-mm receiver systems the Narrabri atmospheric seeing monitor (ASM) has commenced operation. In future it will be the prime tool to monitor the atmospheric phase stability for the array. Based on its output, observers will be able to assess shortly before the start of their scheduled observing runs whether 3- or 12-mm observations will be carried out or whether instead to conduct a centimetre swap program.
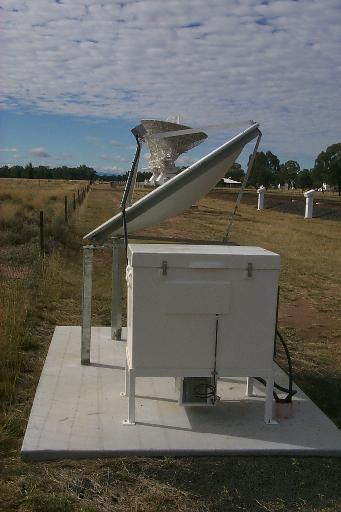
Figure 1: The western station of the ASM, with its eastern counterpart visible in the background. Photo: Michael Dahlem
Test operation of the ASM started in early May 2004. Since then Narrabri staff have been using the data received from the ASM to optimise its operation and its software interface, including a GUI that allows the user to configure his or her own display options when accessing the ASM database. The ASM database stores all data since its inception for later use. Entries describing the atmosphericphase stability will also be entered into the Compact Array data-files in future.
The ASM comprises two reinforced commercial 1.8-m parabolic dishes near two of the Compact Array's base stations (W113 and W128, respectively), with a baseline of about 230 m. It operates at a frequency of 30 GHz, making use of a 30-GHz beacon signal emitted by the Optus-B3 communications satellite. The two parabolic dishes are fixed in a position to point towards Optus-B3 (at an elevation of about 54 degrees). Each station of the ASM has its own electronics to down-convert the radio signal to an intermediate frequency (IF) of 240 MHz, which is transported to a lockin amplifier in the Narrabri screened room (the "correlator room") via optical fibres.
The hardware of each station of the ASM is contained in insulated, air-conditioned cooling boxes, which protect the equipment against external influences (heat, moisture, galahs, kangaroos, human intervention). At the same time, the boxes are radio-tight to avoid causing radio frequency interference. Figure 1 shows the western station of the ASM, with its eastern counterpart visible in the background.
The lockin amplifier and associated electronics are kept in one rack in the screened room, which can be moved or reconfigured for use in telescope holography (from which the hardware was originally adapted). The phase monitor is controlled from a PC running Linux. New monitoring software reads the ASM data from the PC, archives it, and makes it available to client PCs for display. Via a TCP/IP interface a second PC is connected to the data stream for monitoring, maintenance and system re-configuration from the Electronics Lab.
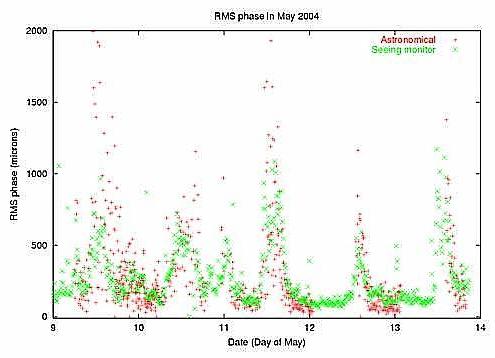 Figure 2: Phase noise measured by the ASM compared with phase noise over 153-m Compact Array baseline.
Once phase-locked, the output of one antenna is used as reference, while the relative phase of the output from the second dish is measured against this reference. The phase noise of one incoming signal compared to the other is a measure of the atmospheric stability over the 230-m baseline spanned by the phase monitor. An example is presented in Figure 2, where phase noise measured by the ASM over a timespan of five days, from 9 – 14 May 2004, is compared with contemporaneous measurements from a 153-m baseline of the Compact Array. The plot shows a good general correspondence. For astronomical use the measured phase noise, which is averaged over a few minutes, typically, is converted into an rms pathlength-noise, as displayed in Figure 2.
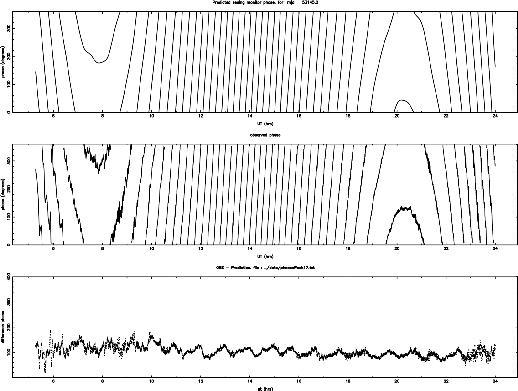
Figure 3: Top panel – predicted phase. Middle panel – observed phase. Bottom panel shows the atmospheric contribution to the phase, obtained as difference between observed and predicted phase.
Optus provides us with an accurate prediction of the satellite position from which we can predict the phase top panel, Figure 3. This allows us to correct for the satellite diurnal motion, which produces the turns of phase, as shown in the second panel of Figure 3. The difference, in the third panel, provides a clear picture of the atmospheric contribution to the phase. The online processing currently tracks the rms of two-point differences.
Final testing and fine-tuning of the system is underway and observers can expect to have the seeing monitor available during their upcoming millimetre observations.
Congratulations and thanks to the Narrabri and Marsfield teams for their successful completion of the project. In particular, credit goes to G. Graves, B. Parsons, M. Kesteven (Marsfield), R. Behrendt, D. Brodrick, B. Hiscock, C. Leven, J. McFee, S. Munting, C. Murphy, B. Reddall and B. Tough.
Michael Dahlem
(Michael.Dahlem@csiro.au)