First light at 7 millimetres
Ilana Feain and Maxim Voronkov (ATNF)
As of April 2007, the Compact Array has receiving capabilities in the range 30 – 50 GHz on all six antennas. The ATNF and NASA’s Deep Space Network for spacecraft tracking have jointly funded the system. It is expected that the DSN program will be allocated around 10 hours per week over the next few years. Towards the end of the four-week shutdown, we ventured up to the Compact Array to test the science-readiness of the system. For the first few days, we watched while the engineers worked tirelessly to complete the installation on schedule. When they finished late on the last night of the shutdown, and we were able to get our hands on the array, we found a beautifully working system with excellent characteristics! Figure 1 shows the receiver temperatures (upper panel) and the system temperatures (lower panel) as measured with a spectrum analyser for one polarisation (A) on one of the antennas (CA03). The characteristics are slightly different on each antenna and for each polarisaton. System temperatures of order 50 – 60 K are expected near the lower end of the band rising, due to the pressure-broadened atmospheric oxygen line at around 60 GHz, to around 100 K toward the upper edge of the 7-mm band. The sensitivity of the array for Fourier synthesis imaging may be estimated using the online sensitivity calculator ( www.atnf.csiro.au/observers/docs/at_sens/), which also accounts for atmospheric opacity.
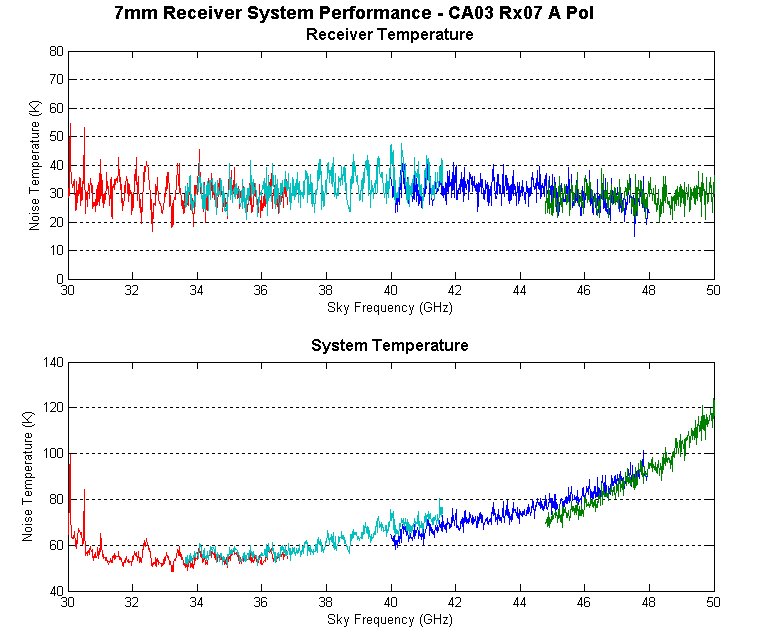
Figure 1: 7-mm receiver and system temperatures (click on image for full-size display)
We observed many objects across a range of frequencies and correlator configurations over the weekend to test the system. But really, we could have just as well been observing at 12 mm because we didn’t notice the difference — the system was superbly stable and absolutely ready for science! So thank you to Warwick Wilson, Graham Moorey and Graeme Carrad (the Project Leader, Engineer and Manager, respectively) as well as the ATNF receiver and workshop groups for this wonderful new facility.
Demonstration science
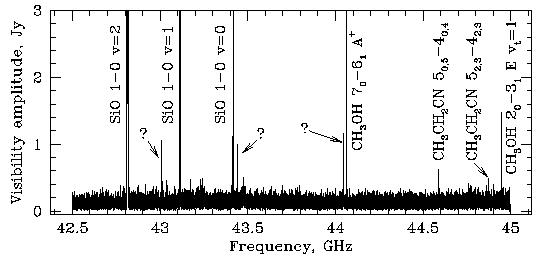
Figure 2: A 7-mm spectrum showing emission from silicon monoxide, methanol and ethylcyanide.
As a good demonstration of the system, we made a shallow spectral scan of the Kleinmann-Low (KL) nebula in Orion Molecular Cloud 1 (OMC-1). This source is known to be an abundant reservoir of molecular gas. The scan covered the sky frequencies from 42.5 to 45 GHz contiguously, with an effective integration time of 1.5 minutes. We used a correlator configuration that provided 256 spectral channels over a bandwidth of 16 MHz, for each of two frequencies. It took 96 separate receiver tunings to cover the whole scanned frequency range. The central frequencies of each 16-MHz window were set at 13-MHz intervals to provide some overlap required for a smooth stitching of the spectra. Each 16-MHz window was processed the same way, starting from calibration using the continuum source 0539–057 with an assumed flux density of 1.44 Jy at 43 GHz and a spectral index of –0.3. Then, a strong continuum associated with OMC-1 was subtracted off and all baselines (except those to the distant antenna 6) were averaged together. The amplitude spectra obtained for each 16-MHz window were “stitched” together using a weighted (with 1/bandpass factors) gridding procedure with the Gaussian kernel (FWHM is approximately 20% of the channel width). This gave an effective spectral resolution of about 0.5 km/s.
The resulting spectrum is shown in Figure 2. The spectrum is dominated by the strong SiO and methanol lines. Thermal transitions of ethylcyanide can also be reliably identified. However, we were unable to identify three spectral lines clearly present in the data (the rest frequencies are around 43016.7, 43447.7 and 44053.2 MHz). These transitions are not listed in the 2002 revision of the National Institute of Standards and Technology (NIST) recommended rest frequencies database (Lovas & Dragoset; physics.nist.gov/PhysRefData/Micro/Html/contents.html) and therefore their detection in star forming regions has probably never been reported before. It seems unlikely that these spectral features are high-velocity components of known strong transitions because velocities in excess of 100 km/s would be required. The 43016.7 and 44053.2 MHz spectral features could be caused by highly excited transitions of SO2. The third unidentified transition remains a mystery. New Compact Array observations are required to confirm the detection. In addition, imaging could help in associating this transition with one of the cores and, hence, in narrowing down the list of candidate species because the chemistry differs from core to core in OMC-1.