Spectroscopy Questions
(Answers for many of these questions will be posted shortly, others simply require reference back to other pages in the Spectroscopy section).
- Sketch intensity plots for i) a continuous spectrum, ii) an absorption spectrum and iii) an emission spectrum.
- Sketch Planck curves for a 5,500 and a 5,000 K black body on the same axes. Identify and account for two differences in the curves. In what ways are they similar?
- Identify an astronomical source for each of the following types of spectrum: i) An emission spectrum, ii) an absorption spectrum.
- Sketch the photographic spectrum you would expect to see from i) an incandescent lamp, ii) a hydrogen gas discharge tube, iii) reflected sunlight and iv) a fluorescent lamp.
- Account for the spectral features you would expect to find in an emission nebula such as M 42, the Great Nebula of Orion.
- Why do we see spectral lines of ionised He+ in O-class stars but not in the Sun's spectrum?
- What does the presence of large number of molecular spectral lines in M-class stars suggest about their effective temperature?
- Describe two ways in which the spectrum of a star can be used to determine its effective temperature.
- If the core of a main sequence star acts like a black body source of a continuous spectrum, why doe we typically see absorption lines in stellar spectra?
- Why do most modern astronomical spectrographs uses diffraction gratings rather than prisms to disperse light?
- Why is it necessary to have an arc lamp of a specific known gas in many types of spectrographs?
- How has the use of photoelectric devices such as CCDs improved the efficiency of astronomical spectroscopy?
- What is meant by multifibre spectroscopy? Name an example of a multifibre spectrograph.
- Why is multifibre spectroscopy so valuable?
- Outline one recent astronomical project that utilised multifibre spectroscopy and discuss how its results have contributed to the development of our understanding of the Universe.
- Why does an O-class star appear blue and an M-class star appear red?
- Does the fact that Helium lines are non-existent in a K-class star mean that it has no Helium in it? Account for your response.
- If a star has a peak wavelength of 450 nm at maximum intensity calculate its effective temperature.
- This question refers to the four stellar spectra shown below.
 Credit: Spectra courtesy of The Sloan Digital Sky Survey
Which of the four stars, A, B, C or D is hottest? Justify your answer. (Ignore the blue background lines in each spectrum).
- In the diagram in question 19 above, which star is coolest? How can you tell?
- Why was it necessary to introduce the concept of luminosity class?
- Construct a table showing the spectral classes, key spectral features, colour and effective temperature range for stars.
- Describe how it is possible to determine the rotation rate of a star from its spectrum.
- A star in our galaxy is observed to have all its spectral lines redshifted by a small fraction. What is the most obvious deduction you could make from this observation?
- Two stars of the same spectral class have a small section of their spectra shown below.
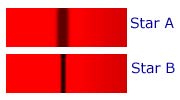
Which of these two stars is more likely to be a main sequence star, A or B? Explain your choice.
- a) What name is given to the set of lines shown below? b) In which spectral class of star would they be most prominent?

- Sketch intensity plots comparing an absorption line for two stars of the same spectral class who differ only in their rate of rotation
- Using the spectra shown below, calculate the effective temperature for each of the stars. State any assumptions you make and show full working. (Ignore any effect of redshift).
 Credit: Spectra courtesy of The Sloan Digital Sky Survey
 - What is the spectral class for each of the stars shown in the question above?
- In the spectrum for Star 1 shown in question 28, what are the prominent spectral features? What does the width of the absorption lines suggest about the star?
- Given the spectral and luminosity class of the following stars, describe the physical characteristics of each of them and the state the key spectral features you would expect to find.
Star Classes Physical characteristics Key spectral features Sirius A1 V Betelgeuse M2 Ia Sun G2 V Procyon F5 IV Murzim B1 II-III - There are four unknown spectra in the diagram below. Classify each of them as either a star, a quasar or a galaxy.
 Credit: Spectra courtesy of The Sloan Digital Sky Survey
 - If a galaxy shows strong HII (ionised hydrogen) lines in its spectrum, what does this suggest about the rate of star formation in that galaxy?
- Quasars or QSOs show Lyman α lines in the visible part of their spectra obtained on Earth. a) What does this suggest about them? b) Why do we not observe Lyman α lines in the visible region of stellar spectra even though stars have abundant hydrogen present?
Education
Public