
HIPASS Bright Galaxy Catalog
Bärbel Koribalski (ATNF)
+ HIPASS and ZOA teams
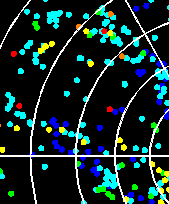
Spatial distribution of the HI brightest galaxies in the southern sky
Velocities are color coded in bins of 1000 km/s:
| dark blue | circle | v < 1000 km/s |
| light blue | cross | 1000 < v < 2000 km/s |
| green | star | 2000 < v < 3000 km/s |
| yellow | triangle | 3000 < v < 4000 km/s |
| orange | square | 4000 < v < 5000 km/s |
| red | plus | 5000 < v < 6000 km/s |
| red | cross | v > 6000 km/s |
| black | dot | HVCs? |
Figure 1a: Aitoff projection.
The most outstanding structures in the sky distribution are the Supergalactic
Plane and the Local Void.


Figure 1b: Stereographic projection.


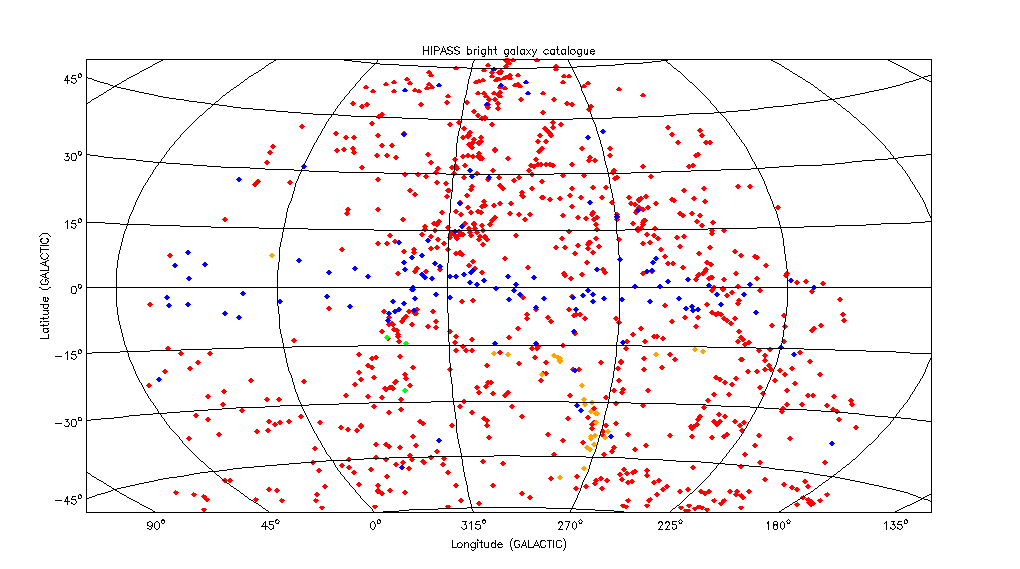
Figure 1c: Galactic distribution.

Figure 1d: Galactic distribution, Aitoff projection (partial).
All the new galaxies, most of which are at |b| < 10 degrees, are marked
in blue, HI clouds in green, and HVCs in orange (plot by Malte Marquarding,
aips++).

Figure 1e: Supergalactic distribution, ZEA projection (partial).
All the new galaxies are marked in blue, HI clouds in green and HVCs in
orange. (plot by Malte Marquarding, aips++).


