|
ATNF Pulsar Catalogue Tutorial Pages: Introduction 1: The simplest query 2: Using the standard parameter set 3: Defining your own display parameters 4: Sorting 5: Conditional logic statements 6: Filtering on pulsar names 7: Finding pulsars within a circular region 8: Formatting the output 9: Obtaining the plotted output 10: Playing with the applet 11: Using the expert parameters |
Plotting Applet Page 9: Obtaining the plotted output This lesson is the final section of the whole tutorial and the focus will be on the plotting applet. It enables you to plot over any 2 variable expressions. The word 'expression' is used because an axis definition can be more than just 'p0' or 'dm'. You can also have 'log10(p0)' or 'dm+100' and so on, as long as it is valid C syntax. Loading up the plot applet Let's have a look at an example. Click on the "Clear All" button at the bottom of the page. Down at the bottom of the page, there is also the input fields for the "Plotted Output" to the right of the page. For the X-Axis, type in "log10(p0)" and for the Y-Axis, type in "log10(p1)". This is quite a nice plot because it shows pretty much all the capabilities of the plotting application in one plot. You'll see what is meant by that soon. Before you click on the "Plot" button, notice that there is a pull-down box next to each of the axis definition text input fields. These determine how the axes should be scaled, either linearly (default) or logarithmically. Hence, if you had "p0" for the X-Axis definition and "p1" for the Y-Axis definition and selected a log scale for both the axes, you would have the same plot as if you have "log10(p0)" for X and "log10(p1)" for Y with linear scaling for both axes. The only real difference is with the scaling of the axes. Now, click on the "Plot" button at the bottom of the page to bring up the applet. You should get the following input and output screens: 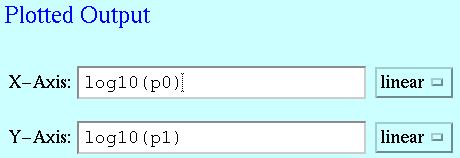
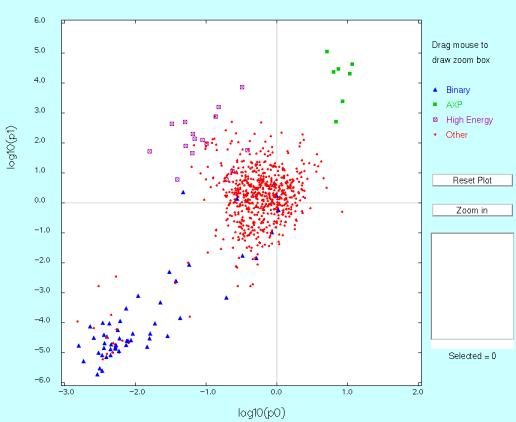
If you are unable to see a plot (You just see a plain white or grey square) then click on the link to the top left of the page called "Can't see the plot applet?". This will lead you to a help page to download a few things. Don't worry, these downloads are perfectly legal and are free. Next lesson will be on playing around with the plot applet that you've just loaded up. Time to have some FUN!!! next page >> |
This loads a font easier to read for people with dyslexia.
This renders the document in high contrast mode.
This renders the document as white on black
This can help those with trouble processing rapid screen movements.