Diagnostics and job management
Running the processASKAP.sh script will also create two scripts that are available for the user to run. These reside in the tools/ subdirectory, and are tagged with the date and time that processASKAP.sh was called. Symbolic links to them are put in the top level directory. These scripts are:
reportProgress.sh – (links to tools/reportProgress-YYYY-MM-DD-HHMMSS.sh) This is a front-end to squeue, showing only those jobs started by the most recent call of processASKAP.sh. It can take two options:
- -v : provides a list of the jobs along with a brief description of what that job is doing.
- -r : shows only the jobs that are running (useful if a lot of jobs are waiting in the queue)
killAll.sh – (links to tools/killAll-YYYY-MM-DD-HHMMSS.sh) This is a front-end to scancel, providing a simple way of cancelling all jobs started by the most recent call of processASKAP.sh.
In each of these cases, the date-stamp (YYYY-MM-DD-HHMMSS) is the time at which processASKAP.sh was run, so you can tie the results and the jobs down to a particular call of the pipeline.
If you have jobs from more than one call of processASKAP.sh running at once, you can run the individual script in the tools directory, rather than the symbolic link (which will always point to the most recent one).
The list of jobs and their descriptions (as used by reportProgress.sh) is written to a file jobList.txt (which is a symbolic link, linking to slurmOutput/jobList-YYYY-MM-DD-HHMMSS.txt). There are symbolic links created in the top level directory (where the script is run) and in the output directory.
For future reference, the configuration file is also archived in the slurmOutput directory, with the timestamp added to the filename. This will allow you to go back and see exactly what you submitted each time.
Each of the individual askapsoft tasks produces a log file that includes a report of the time taken and the memory used. The processing scripts extract this information and place them in both ascii table and csv formatted files in the stats/ directory. These files are named with the job ID, the number of cores used, a description of the task, along with an indication of whether the job succeeded (‘OK’) or failed (‘FAIL’). For distributed jobs, a distinction is made between the master process (rank 0) and the worker processes, and for the workers both the peak and average memory useage are reported. This is important for tasks like cimager where there are clear differences between the memory usage on the master & worker nodes.
Upon completion of all the jobs, these files are combined into single tables, placed in the top-level directory and labelled with the same time-stamp as above. Here is an excerpt of a typical stats file:
  JobID    nCores                                       Description   Result      Real      User    System    PeakVM   PeakRSS                StartTime
4460004         1                                    split_BPCALB00       OK       8.9      0.73      1.08       487       136  2018-06-08T20:21:24,630
4460005         1                                 flag_BPCALB00_Dyn       OK     10.33      9.34      0.44       470       120  2018-06-08T20:21:39,974
4460077         1                              applyBP1934_BPCALB00       OK     21.91     21.27      0.53       483       146  2018-06-08T20:47:30,309
4460113         1                                      split_F00B00       OK    544.95     64.02    149.75       531       181  2018-06-08T20:21:42,092
4460114         1                                    applyBP_F00B00       OK   3119.34   3060.18     51.39       483       146  2018-06-08T20:47:30,310
4460115         1                                   flag_F00B00_Dyn       OK   1469.36   1375.93      64.4       471       121  2018-06-08T21:39:42,799
4460116         1                                        avg_F00B00       OK    143.78     85.39      41.1       540       175  2018-06-08T22:04:22,974
4460117         1                                 flagAv_F00B00_Dyn       OK     42.18     37.79      1.64       406        56  2018-06-08T22:06:57,483
4460118       145                           contSC_F00B00_L0_master       OK    308.06    289.86     17.97      6379      4002  2018-06-08T22:07:56,605
4460118       145                       contSC_F00B00_L0_workerPeak       OK    308.06    289.86     17.97      4561      2466  2018-06-08T22:07:56,605
4460118       145                        contSC_F00B00_L0_workerAve       OK    308.06    289.86     17.97    2158.8    1541.2  2018-06-08T22:07:56,605
4460118       145                           contSC_F00B00_L1_master       OK    736.05    605.89     129.9      7160      4002  2018-06-08T22:18:44,012
4460118       145                       contSC_F00B00_L1_workerPeak       OK    736.05    605.89     129.9      5577      2466  2018-06-08T22:18:44,012
4460118       145                        contSC_F00B00_L1_workerAve       OK    736.05    605.89     129.9    2222.0    1541.2  2018-06-08T22:18:44,012
This information is also presented graphically, in a PNG image (statsPlot-YYYY-MM-DD-HHMMSS.png, which is put in both the top-level directory and the diagnostics directory. Here is an example:
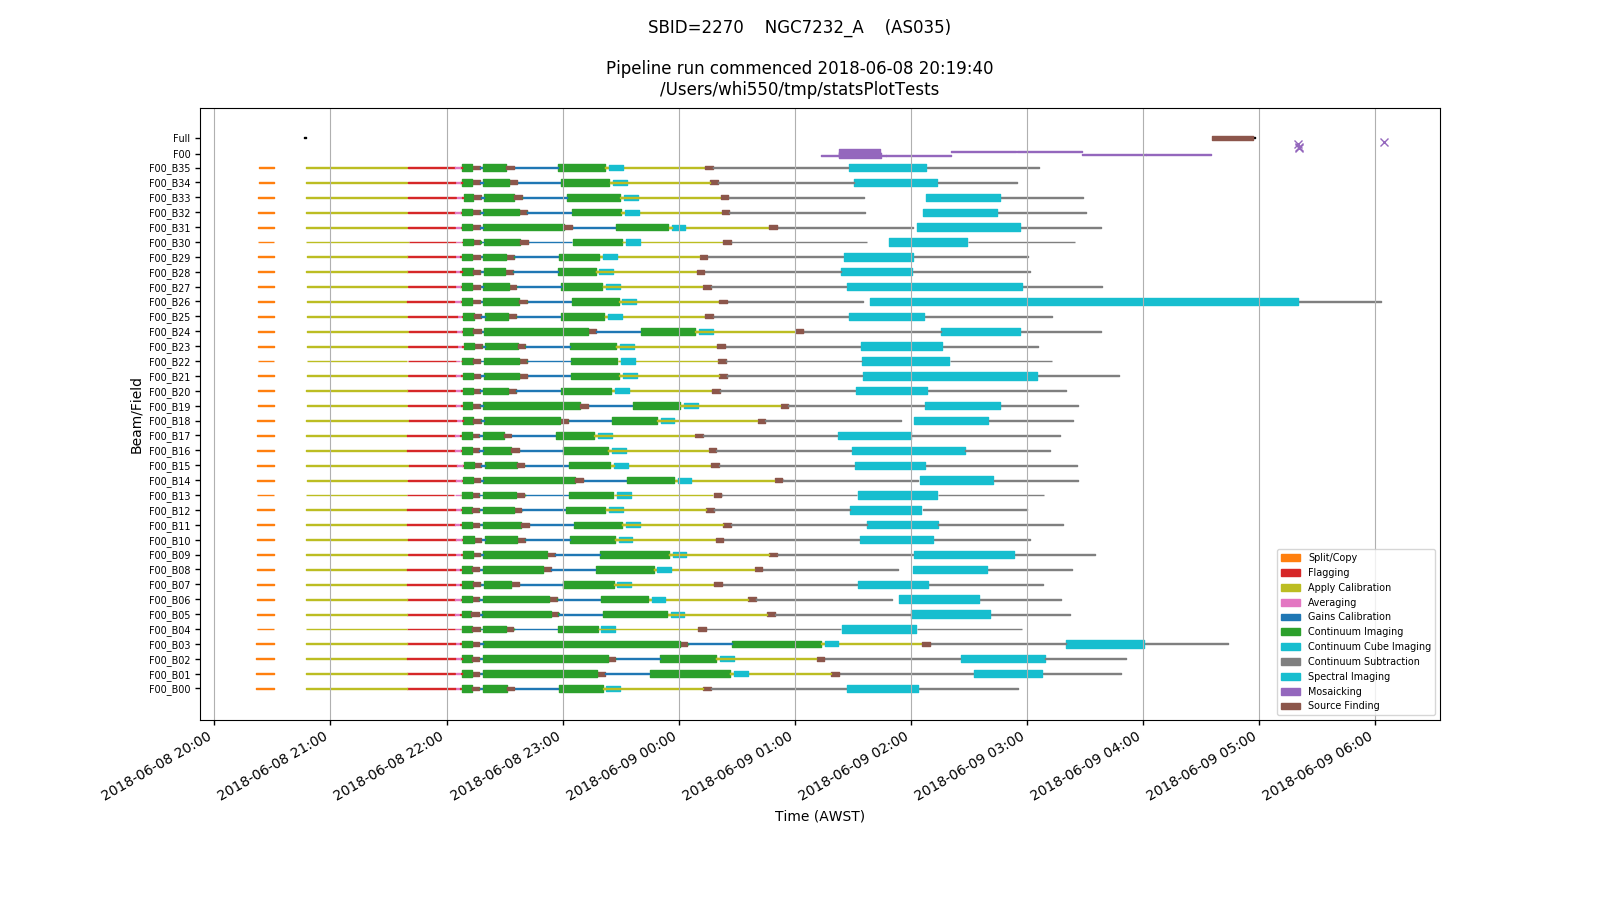
Each row in the plot corresponds to a single beam/field combination, with mosaicking jobs for a given field getting their own row, and mosaicking and source-finding jobs for the overall observation getting a further row (at the top).
Each type of job has its own colour, and the width of the line for each job indicates the number of cores used. Jobs that fail are represented by crosses at the start time.