
The Grus-Quartet
Bärbel Koribalski (ATNF)


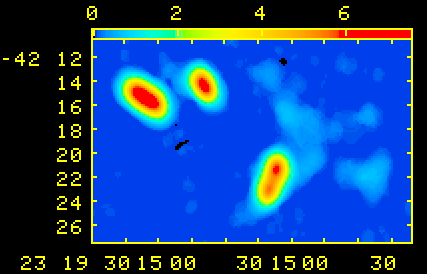
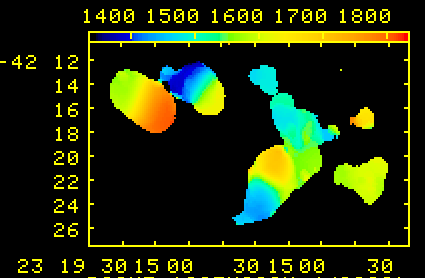
The Grus-Quartet consists of four large spiral galaxies which are so close to each other that they should be interacting. The high starburst activity of two of the members, namely NGC 7552 and NGC 7582, is also thought to arise from tidal galaxy-galaxy interactions and subsequent formation of a bar in the disk. As the 21-cm line of the neutral hydrogen atom (HI) is the best tracer for extended emission from galaxies, we have observed the Grus-Quartet with several configurations of the Australia Telescope Compact Array (ATCA). My collaborators in this project are Tracy E. Lavezzi and John M. Dickey from the University of Minnesota (USA) and John Whiteoak (ATNF). Figure 4 shows the HI distribution (contours) of NGC 7582 and two neighbours, NGC 7590 and NGC 7599, overlaid onto the optical emission (greyscale) from the Digitized Sky Survey (DSS) . The contour levels are 0.15, 0.3, 0.6, 1.2, 2.25, and 4.5 Jy/beam km/s. Please note that no primary beam correction has been applied here. Several tidal tails are visible extending from NGC 7582, one pointing towards the neighbours in the east and the other towards NGC 7552 which lies at a projected distance of approx. 30' to the northwest. Only data obtained with the 375-m array of the ATCA have been used to produce this image. The angular resolution is about 1.5'. The interaction between the group members is also clearly visible in their velocity fields. A detailed description of these and other interacting galaxies plus a global scenario relating the tidal interaction to the bars, nuclear rings and starburst activity observed in most of these galaxies is given by Koribalski (1996, in the ``The Minnesota Lectures on Extragalactic HI'', ASP Conf. Series 106, ed. Evan D. Skillman, p. 238).

Figure 1: HI distribution of the interacting galaxy group consisting of NGC 7582 (right), NGC 7599 (left) and NGC 7590 (middle). Tidal tails are clearly visible to the north and west of NGC 7582. (The colour gradient is in units of Jansky/beam km/s.)

Figure 2: HI mean velocity field of the same group. (The colour gradient is in units of km/s.)

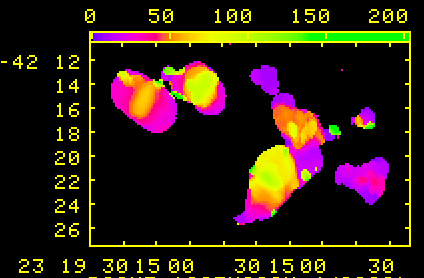
Figure 3: HI mean velocity dispersion of the same group. (The colour gradient is in units of km/s.)
An overlay of the HI distribution and optical emission (Figure 4) is available here (222 kbyte).
Baerbel.Koribalski @ csiro.au