How does a Spectrograph Work?
A spectrograph is an instrument used to obtain and record an astronomical spectrum. The spectrograph splits or disperses the light from an object into its component wavelengths so that it can be recorded then analysed. These steps are discussed in more detail below.
Dispersing Light
Light entering a spectrograph can be split or dispersed into a spectrum by one of two means, using a prism or a diffraction grating. When Newton split light into a spectrum in the 1660s he used a glass prism. School students often use perspex prisms from ray box kits to disperse or “split” white light from an incandescent bulb into the component colours of the spectrum. This effect arises due to the fact that the different wavelengths of light also have different frequencies. As they pass through a prism, they undergo refraction, a change in velocity due to the change in medium. If the light falls incident to to the prism at an angle other than 90° it will also change direction. Red light has a longer wavelength than blue light so its angle of refraction is lower, both at entry to and exit from the prism. This means it gets bent less. The light emerging from the prism is dispersed as shown schematically in the diagram below.
Most astronomical spectrographs use diffraction gratings rather than prisms. Diffraction gratings are more efficient than prisms which can absorb some of the light passing through them. As every photon is precious when trying to take a spectrum from a faint source astronomers do not like wasting them. A diffraction grating has thousands of narrow lines ruled onto a glass surface. It reflects rather than refracts light so no photons are “lost”. The response from a grating is also linear whereas a prism disperses blue light much more than in the red part of the spectrum. Gratings can also reflect light in the UV wavebands unlike a glass prism which is opaque to UV. A common example of a diffraction grating is a CD where the pits encoding the digital information act as a grating and disperse light into a colourful spectrum.
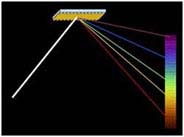 Credit: NASA Dispersion of light from a diffraction grating. | 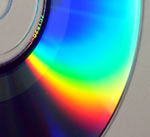 Credit: CSIRO Diffraction from the pits in a CD. |
Structure of a Spectrograph
The schematic diagram below shows the key components of a modern slit spectrograph.

Credit: Adapted from a diagram by James B. Kaler, in “Stars and their Spectra,” Cambridge University Press, 1989.
The slit on the spectrograph limits the light entering the spectrograph so that it acts as a point source of light from a larger image. This allows an astronomer to take a number of spectra from different regions of an extended source such as a galaxy or of s specific star in the telescope’s field of view. Light is then collimated (made parallel) before hitting a diffraction grating. This disperses the light into component wavelengths which can then by focused by a camera mirror into a detector such as a charged-couple device (CCD). By rotating the grating different parts of the dispersed spectrum can be focused on the camera. The comparison lamp is vital in that it provides spectral lines of known wavelength (eg sodium or neon) at rest with respect to the spectrograph, allowing the spectrum of the distant source to be calibrated and any shift of spectral lines to be measured.
Recording the Spectrum
Newton recorded the spectrum of sunlight by drawing it. The rise of spectroscopy for astronomical use was in part due to its linkage with another emerging technology – photography. Astronomical spectra could be recorded by photographing them on glass plates. This was a far superior approach to viewing them with through an eyepiece and trying to draw the image. Photographic records of spectra could be stored for later analysis, copied for distribution or publication and the spectral lines could be measured relative to spectral lines from a stationary lamp producing spectral lines of known wavelength. It was only by observing and photographing the spectra of thousands of stars that astronomers were able to classify them into spectral classes and thus start to understand the characteristics of stars. Photographic spectra were generally recorded on glass plates rather than photographic film as plates would not stretch. The image of the spectrum was normally presented as a negative so that the absorption lines show up as white lines on a dark background. The example below shows the photographic spectrum of a standard reference star, α Lyrae from the 1943 An Atlas of Stellar Spectra.
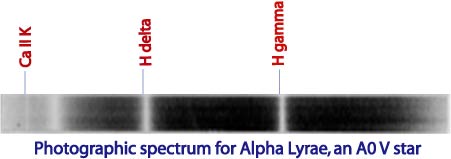
Credit: Adapted from An Atlas of Stellar Spectra
, Morgan, Keenan, Kellman
Photoelectric spectroscopy allows spectral information to be recorded electronically and digitally rather than on photographic plates. Modern astronomical charged-couple devices or CCDs can reach a quantum efficiency of about 90% compared with about 1% for photographic emulsions. This means a CCD can convert almost 9 out of 10 incident photons into useful information compared with about 1 in 100 for film. Using a CCD an astronomer can therefore obtain a useful spectrum much quicker than using a photographic plate and can also obtain spectra from much fainter sources. CCDs have a more linear response over time than photographic emulsions which lose sensitivity with increased exposure. A spectra recorded on a CCD can be read directly to a computer disk for storage and analysis. The digital nature of the information allows for rapid processing and correction for atmospheric contributions to the spectrum. Modern spectra are therefore normally displayed as intensity plots of relative intensity versus wavelength as is shown below for a stellar spectrum.
Credit: The Sloan Digital Sky Survey
Intensity plot spectrum for a star.
Multifibre Spectroscopy
The last decade has seen the growth in multifibre spectroscopy. This involves the use of optical fibres to take light from the focal plane of the telescope to a spectrograph. A key advantage of this technique is that more than one spectrum can be obtained simultaneously, dramatically improving the efficiency of observing time on a telescope. Many of the techniques for multifibre spectroscopy were developed at the Anglo-Australian Observatory for use on the AAT and the UK Schmidt telescopes.
The 2dF project revolutionised the emerging field of multifibre spectroscopy by using a computerised robot to precisely position 400 minute prisms onto a metal plate so that each prism could gather light from an object such as a galaxy or quasar. Attached to each prism was an optical fibre that feeds into a spectrograph. The 2dF instrument sits at the top of the AAT and can take spectra from 400 objects simultaneously over a 2 degree field of view. Whilst observing one field, the robot sets up a second set of prisms on another plate which can then be flipped over in a few minutes to begin observing a new field. This incredibly efficient system allows spectra from thousands of objects to obtained in a single night’s observing run.
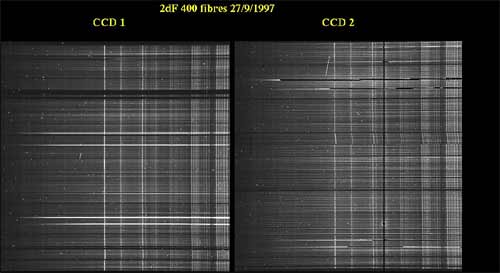
Credit: The 2dF Galaxy Redshift Survey
400 spectra from a 2dF field. There are 2 CCDs each recording 200 spectra that are fed in by fibres coming from the field plate atop the AAT.
Two key projects, the 2dF Galaxy Redshift Survey and the 2dF QSO Redshift Survey provided the scientific impetus for building this multifibre instrument. These surveys produced accurate data on over 250,000 galaxies and 25,000 quasars that have proved an immense boon for cosmologists studying the formation and large-scale structure of the Universe.
Australian astronomers and engineers continue to design, develop and build new multifibre devices for the latest generation 8-10 m class telescopes overseas. An Australian consortium from the AAO, ANU and UNSW has just built OzPoz, a multifibre spectrograph for ESO’s VLT in Chile. It develops the techniques used in 2dF and currently allows 132 spectra to be gathered simultaneously. Future instruments such as Echidna and AAOmega are under development at present.
Spectroscopy at other Wavebands
Spectroscopy is not just the tool of optical astronomers. It can be carried out at all wavebands, each of which provides new insights into the structure and characteristics of celestial objects.
Infrared spectroscopy allows astronomers to study regions of star birth obscured to optical astronomy by cold clouds of dust and gas. Australia is actively involved in infrared astronomy and has built infrared spectrographs such as IRIS 2 for the AAT and the ANU’s 2.3 m telescope at Siding Spring. The Research School of Astronomy and Astrophysics at Mt Stromlo in Canberra was building the Near IR Integral Field Spectrograph (NIFS) for the 8.1 m Gemini North telescope in Hawaii when fire destroyed most of the facilities on the mountain in early 2003. A replacement NIFS has now been made and will soon be in use on Gemini.
High-energy spectroscopy in the X-ray and γ-ray regions is more difficult s the instruments have to withstand the rigours of a rocket launch and the harsh environment of space. As high energy photons have much shorter wavelengths traditional optical designs for spectrographs are not suitable or able to be adapted. The resolution of high energy spectrographs cannot match optical ones at present but they allow us to gain greater understanding of violent, energetic objects and events in the Universe.
Radio astronomers also gain spectral information from their observations. Receivers used on radio telescopes can pick up thousands of bands in a given region of the radio band just as you could obtain by moving a radio dial through several stations and measuring the intensity of the received signal. This information effectively provides details about the various transitions emitted by matter. Radio spectral data can give details about frequency and velocity. It can also provide information about the polarisation of the signal, information not normally available in visible spectra. Improvements in receivers and detectors now allow astronomers to routinely observe at mm-wavelengths where there is a wealth of spectral lines from molecules in space. Molecules such as acetic acid and formaldehyde have been discovered in interstellar clouds and the search continues for the signature of amino acids such as glycine. Information on these will prove vital for astrobiologists and astrochemists.
Previous: How are Spectra Produced?
Next: Astronomical Spectra