Radio emission from the 27 December 2004 giant flare from SGR 1806-20
Neutron stars (NS), in all their forms, provide an unique view into the properties of ultra-dense materials (with core densities possibly exceeding that of atomic nuclei) as well as the physics of extremely high magnetic fields (B ~ 1012 – 1016 G). Of particular interest are two, probably related, classes of NS — Anomalous X-ray Pulsars (AXPs) and Soft Gamma-ray Repeaters (SGRs). AXPs and SGRs have very different observational properties from those of radio pulsars, namely the lack of pulsed radio emission, very long rotation periods (~ 5 – 12 sec as opposed to ~ 0.002 – 8 sec period of radio pulsars), and frequent bursts (luminosity L ~ 1037 – 1046 ergs/s in the hard X-ray/soft g -ray regime, with the "giant bursts" with as high as ~ 1046 ergs/s being extremely rare. The currently favoured models for both AXPs and SGRs is that they are "magnetars" young NS with very high magnetic fields (B ~ 1014 – 1016 G) whose quiescent emission is due to magnetic field decay, not spin-down as for radio pulsars, and whose bursts are believed to be triggered by "starquakes" on the neutron star's crust.
Until recently, only two giant bursts had been observed one on 5 March 1979 from SGR 0526-66 and one on 27 August 1998 from SGR 1900+14. While no radio afterglow was detected from the 5 March event, a Very Large Array (VLA) observation seven days after the 27 August event detected a new, faint (0.3 mJy at 8.5 GHz) radio source which disappeared from view after 11 days (Frail et al. 1999). While faint, this radio detection was important in understanding the physical mechanism behind these giant bursts since the magnetar model (among others) predicts the expulsion of relativistic particles from the surface of the NS during these events. Unfortunately, this radio source was not detectable for a long enough period of time to measure the properties of the material driving the nebula (e.g. its mass and energy) precisely enough to compare with the theoretical predictions.
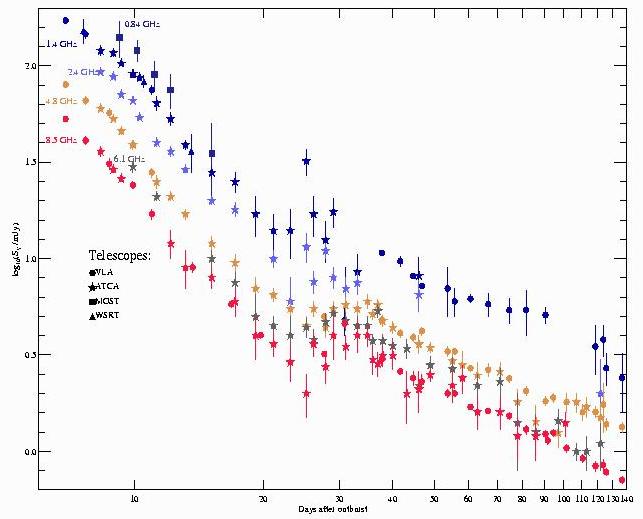 Figure 1: The 0.8, 1.4, 2.4, 4.8, 6.1, and 8.5 GHz light curve of the synchrotron nebula produced by the 27 December giant flare. The data points taken between 6 and 20 days after the flare were originally reported in Gaensler et al. (2005b), while the 4.8-GHz data taken between 20 and 63 days after the flare were originally reported in Gelfand et al. (2005)
On 27 December 2004, SGR 1806-20 emitted a giant flare (GF) which was by far the brightest such burst from a magnetar, and in fact was the brightest event ever detected in the history of g-ray astronomy. The burst was so bright that it saturated every g-ray detector in space (Palmer et al. 2005; Hurley et al. 2005; Mereghetti et al. 2005; Israel et al. 2005), save for a small g-ray detector on a Russian spacecraft designed to study the solar wind which was in the Earth's shadow at the time of the events and detected g-rays which were reflected by the Moon (Mazets et al. 2005). Seven days after the GF, SGR 1806-20 was observed with the VLA which detected (Cameron & Kulkarni 2005; Gaensler et al. 2005a) not a faint radio source but an extremely bright one over 170 mJy at 1.4 GHz (Gaensler et al. 2005b; Cameron et al. 2005). As a result, a worldwide radio monitoring campaign of this source began which incorporated a large number of radio telescopes including the Australia Telescope Compact Array (ATCA), whose broadband receivers allowed us to monitor the source at five frequencies (1.4, 2.4, 4.8, 6.1, and 8.5 GHz, with 2.4 and 6.1 GHz only achievable with the ATCA) in a single observation, invaluable for the success of this project the results of which are shown in Figure 1. Thanks to the dense temporal coverage of twice-a-week observations with both the VLA and ATCA for the first two months after the flare, we have identified the following regimes in the light curve:
♦ An initial, relatively flat decay in flux (S µ td) with a variable decay rate across the frequencies e.g. at 1.4 GHz, d = -1.6 ± 0.2 while at 8.5 GHz, d = -2.2 ± 0.2 (Gaensler et al. 2005b).
♦ Around nine days after the GF, there was a break in the light curve at all six observed frequencies in which the decay rate steepened to d ~ -2.7 (Gaensler et al. 2005b; Cameron et al. 2005). As reported in Gaensler et al. (2005b), there is no significant change in d across the observed frequencies.
♦ Around 25 days after the GF, the source brightened for roughly 3 – 5 days in all five of the observed frequencies. Thanks to fortuitous timing and spacing of the ATCA monitoring observations, we were able to measure both the rise and fall of this "bump" in the lightcurve (Gelfand et al. 2005).
♦ After the "bump", the flux has decreased as S µ t-1 in all five frequency bands. Due to source confusion, we have not been able (yet) to get 1.4 and 2.4-GHz fluxes at some epochs so the light curve is not as well sampled at these frequencies. However, we see no evidence in the data that we have already reduced that the source is behaving any differently at these frequencies than it is at 4.8 and 8.5 GHz which are somewhat better sampled.
With these results, we have been able to explain the radio source in terms of the "magnetar" model. In this model, the GF is caused by magnetic reconnection triggered by a disturbance on the crust of the NS. This magnetic reconnection creates a lot of g-rays, most of which are ejected during 0.5 sec "hard spike" seen in the g-ray light curve (e.g. Palmer et al. 2005). During this initial "hard spike", matter will be ablated off the surface of the NS and stream into the surroundings (Thompson & Duncan 1995). Since the escape velocity of a NS is ~ 0.4c, this outflow will at the very least be mildly relativistic and will generate shocks that produce the synchrotron radiation seen in the radio creating the radio synchrotron nebula detected after the 27 December GF.
Using the radio light curve, we can trace the evolution of this synchrotron nebula as well as determine its initial properties. We believe that the initial flat-decay radio flux described above was the result of a collision between these particles and a pre-existing shell around the SGR, either from a quiescent particle wind generated by its spin-down or from highly relativistic electrons generated during the GF or in the particle outflow itself. This collision probably happened before the first VLA observation, but due to light-travel effects we observed this collision for several days (Granot et al. 2005). As a result of this collision, most of the ejected material was swept-up into a thin shell which then continued expanding. Assuming the shell maintained a constant thickness as it expanded, the magnetic field inside the source should have dropped precipitously during this phase, which, coupled with adiabatic cooling of the electrons leads to the steep decay in the light curve seen between 9 and 25 days after the GF (Gaensler et al. 2005b; Granot et al. 2005). However, as it expanded, the ejecta from the surface of the NS swept up and shocked the surrounding ISM. The shocked ISM material formed a thin shell around the ejecta material, similar to that seen in supernova remnants. As more and more material was swept-up, the layer of shocked ISM got brighter until it outshone the cold ejecta. At this point the radio source re-brightened, as was observed 25 days after the flare. By modeling the properties of the re-brightening, we are able to estimate that the ejecta had an initial mass of ~ 1024 – 1025 gm and an initial kinetic energy of ~ 1044 – 1045 ergs (Gelfand et al. 2005). While the exact numbers depend on the shock physics, the morphology of the material ejected during the GF and the properties of the surrounding ambient material, this mass and energy is consistent with that predicted by the magnetar model. At the time of re-brightening, it was also expected that the expansion velocity of the source would decrease significantly as observed by the VLA (Taylor et al. 2005) and confirmed by a 12-hr 9.0-GHz ATCA observation on 7 April. After this re-brightening, the source was expected to behave like a supernova remnant in the Sedov-Taylor phase of its evolution (Gelfand et al. 2005), which explains the t-1 decay in the radio flux.
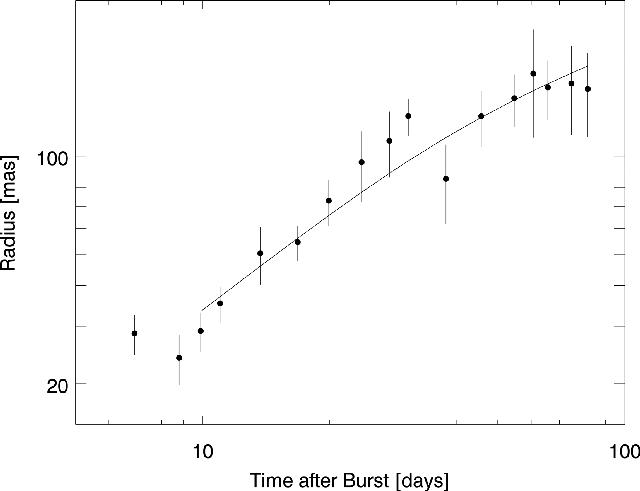 Figure 2: The solid line is a fit of an expanding shell model as described in Gelfand et al. (2005). This plot is Figure 2 in Taylor et al. (2005).
The above description is supported by VLA observations which have allowed us to precisely measure the source's size and position (Gaensler et al. 2005b; Cameron et al. 2005; Taylor et al. 2005). As mentioned above and shown in Figure 2, we have determined that the expansion velocity of the radio nebula significantly decreased at the same time of the observed "re-brightening", from ~ 4.5 mas/day to less than 2.5 mas/day (Taylor et al. 2005). Reduction of these VLA observations has also enabled us to determine that the radio source is significantly elongated, with an axial ratio of ~ 0.6 (Taylor et al. 2005). We have also measured a proper motion of the radio source it appears to be moving along its major axis with an average velocity of ~ 3.0 mas/day, roughly half of its growth rate. As a result, we believed that mass outflow from the NS was predominantly one-sided (Taylor et al. 2005) consistent with the matter being ejected during the initial spike seen in the g-rays. Less than 20 days after the GF, polarized radio emission was detected from the radio source (Gaensler et al. 2005b; Cameron et al. 2005), with the position angle of the linear polarization roughly perpendicular to the major axis consistent with a shock-produced magnetic field (Taylor et al. 2005).
With further observations, we hope to understand better the morphology and size evolution of the source which is important in understanding the ejection mechanism of the material off the NS, as well as the source's behavior during the Sedov-Taylor phase of its evolution and its eventual transition into its radiative phase. The 27 December GF is a once-in-a-human-lifetime event, and possibly a once in a NS's lifetime event as well, and presents a unique opportunity to study the properties of magnetars and the evolution of explosions in the ISM.
References
Cameron, P. B. et al., 2005, Nature, 434, 1112
Cameron, P. B. & Kulkarni, S. R. 2005, GRB Circular Network, 2928
Frail, D. A., Kulkarni, S. R. & Bloom, J. S. 1999, Nature, 398, 127
Gaensler, B., et al., 2005a, GRB Circular Network, 2929
Gaensler, B., et al., 2005b, Nature, 434, 1104
Gelfand, B., et al., 2005, ApJL submitted (astro-ph/0503269)
Granot et al., 2005, ApJL submitted (astro-ph/0503251)
Hurley et al., 2005, Nature, 434, 1098
Israel et al. 2005, ApJL in press (astro-ph/0505255)
Mazets et al., 2005, (astro-ph/0502541)
Mereghetti et al., 2005, ApJL, 624, L105
Palmer et al., 2005, Nature, 434, 1107
Taylor et al., 2005, ApJL submitted (astro-ph/0504363)
Thompson, C. & Duncan, R. C. 1995, MNRAS, 275, 255
Joseph Gelfand (Harvard-Smithsonian Center for Astrophysics), Chryssa Kouveliotou (NASA GSFC), Bryan Gaensler (Harvard-Smithsonian Center for Astrophysics), Yuri Lyubarsky (Ben Gurion University), Greg Taylor (KIPAC/Stanford University/NRAO), David Eichler (Ben Gurion University), Yoni Granot (KIPAC/Stanford University), Katherine Newton-McGee (U. Sydney/ATNF), Enrico Ramirez-Ruiz (IAS), Rob Fender
(U. Southampton) and Ralph Wijers (U. Amsterdam)
(jgelfand@cfa.harvard.edu)