Investigating grain growth in southern protoplanetary disks
Many young stars are surrounded by disks of gas and dust which are a natural by-product of the star formation process. It is within these disks that planets can form. While the exact details of planet formation remain uncertain, we do know that sub-micron sized grains must clump and coagulate together to eventually form objects 1013 - 1014 times larger. Because most star forming regions are located at least 150 pc from the Earth and new born stars are usually obscured from our view inside of dark dusty clouds, we cannot directly observe planets forming. However, examining the physical environment and evolutionary timescales of protoplanetary disks can help us constrain models of planet formation.
Young stars often exhibit an infrared excess above that expected from the stellar photosphere, which is successfully modelled by a pre-main-sequence star surrounded by a disk (Adams et al. 1987). The infrared excess emission is produced by small micron-sized grains in the surface layers of the inner regions (<1 AU) of the disk which are heated by the central star. Infrared surveys of young stellar clusters have found that this inner disk emission vanishes within a few million years (Haisch et al. 2001) either because the disk has dissipated or because the opacity drops as the grains grow in size. One would like to differentiate between these two possibilities in order to constrain the timescales of planet formation.
Observations at millimetre and longer radio wavelengths probe the colder outer regions of the disk which are inaccessible at infrared wavelengths. Therefore surveys of the millimetre continuum around young stars are needed to understand the temporal evolution of the outer regions of protoplanetary disks where the majority of the mass resides. Carpenter et al. (2005) find a decrease in the amount of cold dust emission by 10 - 30 million years, but again cannot distinguish between a decrease in the amount of disk material with time or changes in the opacity due to grain growth. Numerical simulations by Tanaka et al. (2005), however, suggest that grain growth and settling can explain the decrease in observed millimetre fluxes on timescales of a few million years without depletion of the disk.
While surveys of infrared excess and millimetre continuum in stellar clusters tell us about the general lifetime of disks (or the evolution of grains emitting at those wavelengths), we would ideally like to see more direct signatures of grain growth. One way to do this is by studying the 10 micron silicate band emission. Grain growth can be inferred from the observed correlation between the shape and strength of the silicate band, going from strong, peaked spectra at ~9.8 microns to weaker, flatter spectra extending to longer wavelengths (~11.3 microns) as grains grow (Meeus et al. 2003, Przygodda et al. 2003). However, grain growth and crystallisation have a similar effect on the shape of the 10 micron feature. The presence of crystalline silicates in the spectra of young, intermediate mass Herbig Ae/Be stars (Malfait et al. 1998) and young, low mass T Tauri stars (Honda et al. 2003) indicate substantial processing of grains in protoplanetary disks, due to heating processes. To distinguish between grain growth and crystallisation, Kessler-Silacci et al. (2006) conducted a study of 47 young stars with disks with the Spitzer Space Telescope, covering a larger spectral region (from 5 to 35 microns) in order to detect distinct spectral features of crystalline silicates beyond 10 microns. As well as spectral signatures of crystalline forsterite at 11.3 micron in about one third of their sources, they also found longer wavelength crystalline silicate features (at 28 microns and 33 - 35 microns) in the spectra of over half of their objects. However, the 10 and 20 micron amorphous silicate features dominated the spectra of most sources. Analysing the shape versus strength of the 10 and 20 micron features, Kessler-Silacci et al. (2006) concluded that amorphous grain growth could be seen in the majority of these disks.
Grain growth in protoplanetary disks can also be inferred by determining the millimetre slope of the spectral energy distribution (SED). The SEDs of T Tauri stars show that the (sub)mm fluxes decline more slowly with wavelength than expected for small (~0.1 micron) sized interstellar grains. This shallower wavelength dependence is consistent with optically thin emission from millimetre-sized grains (Beckwith & Sargent 1991) and therefore can be used to indicate grain growth. (However, it has been noted by Dutrey et al. (1996) that the disks need to be spatially resolved to break the degeneracy in fitting the SED for small optically thick disks with small grains and extended optically thin disks with larger grains). If the emission is predominantly optically thin, the spectral energy index, α (where Fν ∝ να) can be directly related to the opacity index, β (where kν ∝ νβ) and grain sizes can be inferred from the opacity law. The millimetre spectral slope a is related to the opacity index β via β = (α-2)(1+Δ), where Δ is the ratio of the optically thick to optically thin disk emission (Beckwith et al. 1990). For grains a few tenths of a micron β~2, while for much larger grains β~0. Particles about the same size as the observing wavelength will have intermediate β values.
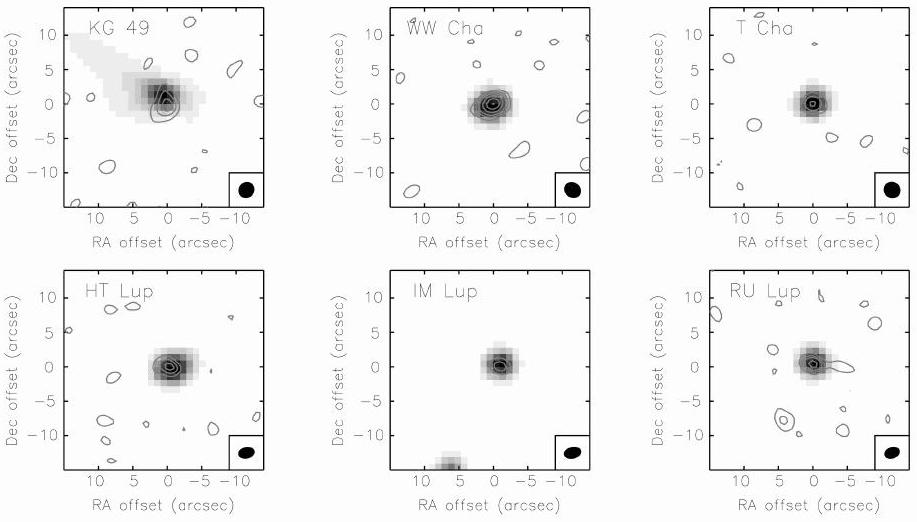
Figure 1: 3.3 mm continuum emission of six of our detected sources, three from Lupus and three from Chamaeleon. The contours are in 2, 4, 6, 10, 15 and 20 times the RMS noise level. The mm and IR peaks are well correlated.
Over the past four years we have been undertaking a 3 mm continuum survey with the Compact Array of disks around nearby young stars (both T Tauri and Herbig Ae/Be stars) in the southern sky to investigate the evolution of protoplanetary disks and grain growth. The goals of our project are to obtain fluxes and hence spectral energy indices, as well as resolve disk structures to probe the physical conditions and help constrain disk models. For our results on the resolved sources TW Hya and HD 100546, see Wilner et al. (2003). Here we present preliminary results from the successful 2005 millimetre season. We observed 14 southern T Tauri sources (ten in Chamaeleon and four in Lupus), detecting nine sources at the 3-σ level and obtaining strict upper limits for a further three sources. See Figure 1 for 3 mm continuum maps of a sample of our survey.
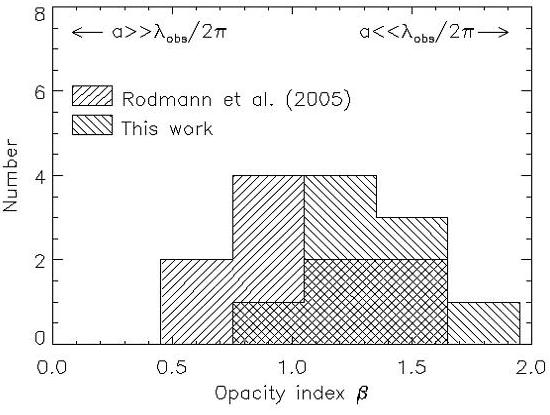
Figure 2: Histogram of opacity index, β, values from
our nine sources plus those of Rodmann et al. (2006).
From these detections we have estimated the disk mass of the systems, which range from 1.4 × 10⁻² - 2.8 × 10⁻³ MSun (which is comparable to the minimum mass solar nebula). By combining our 3 mm fluxes with 1.3 mm fluxes from the literature (Reipurth et al. 1993, Henning et al. 1993, 1998) we have derived the millimetre spectral energy indices, α, and hence the opacity indices, β. Using characteristic values of various disk parameters, Rodmann et al. (2006) estimate that Δ~0.2 and hence we find β≈1 for our sources. See Table 1 for a and b values for a sample of our sources. Figure 2 shows a histogram of β values for the majority of our sources. Plotting the visibility amplitude as a function of baseline length indicates that at least some of our sources are indeed resolved. Thus these opacity indices suggest the presence of mm-sized dust aggregates and hence grain growth in the disks.
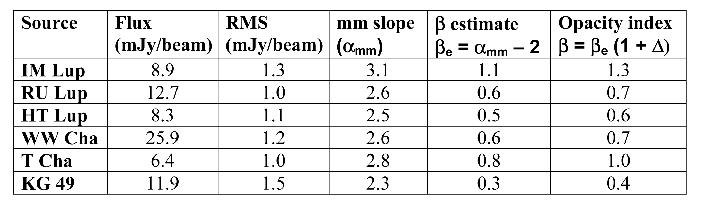
Table 1: Continuum fluxes at 3.3 mm, RMS, millimetre slope αmm and opacity index β for three of our Lupus sources (IM Lup, RU Lup and HT Lup) and three of our Chamaeleon sources (WW Cha, T Cha and KG 49). Note that the fluxes are from point-source fitting in the u-v plane.
Ideally we would like to determine the mm slope of the SED, αmm, by using Compact Array 3 mm and 12 mm fluxes (and hopefully one day 7 mm Compact Array fluxes), rather than having to rely on the 1.3 mm single dish fluxes which may include contributions from the ambient material around the sources. A future aim of our project is to obtain the 12 and 7 mm fluxes with the Compact Array, as well as to image the brightest disks with longer baselines to look for changes in the spectral indices as a function of disk radius.
Seven of our sources overlap with the Spitzer sample of Kessler-Silacci et al. (2006), and we have 3-σ detections for five of these. The broad 10 and 20 micron amorphous silicate features are seen in all sources, further supporting the notion of grain growth in these disks. By doing a detailed comparison of the b values from our study with the infrared spectra of the sources, we can search for correlations to gain a better understanding of grain growth within protoplanetary disks. A similar study of 26 Herbig Ae/Be stars by Acke et al. (2004) found a correlation between the (sub-) millimetre spectral index and the ratio of the near-IR to mid-IR excess, which they interpreted as a relation between the disk geometry and grain size.
The full results of our survey will be presented in Lommen et al. (in prep.) and a detailed study of the resolved source WW Cha will be discussed in Maddison et al. (in prep.).
The authors wish to thank Tony Wong of ATNF/UNSW for all his initial collaboration on this project and help with the 3 mm system, both with the observing and data reduction, especially in the early years of the Compact Array millimetre upgrade.
References
Acke, B., van den Ancker, M.E., Dullemiond, C.P., van Boekel, R., Waters, L.B. 2004, A&A, 422, 621
Adams, F.C., Lada, C.J., Shu, F.H. 1987, ApJ, 312, 788
Beckwith, S.V.W., et al. 1990, AJ, 99, 924
Beckwith,S.V.W., Sargent, A.I. 1991, ApJ, 382, L31
Carpenter, J.M., Wolf, S., Schreyer, K., Launhardt, R., Henning, T. 2005, AJ, 129, 1049
Dutrey, Guilloteau, Duvert et al. 1996, A&A, 309, 493
Haisch, K.E., Lada, E.A., Lada, C.J. 2001, ApJ, 553, L153
Henning, Th., Pfau, W., Zinnecker, H., Prusti, T. 1993, A&A 276, 129
Henning, Th., Burkert, A., Launhardt, R., Leinert, Ch., Steeklum, B. 1998, A&A, 336, 565
Honda et al. 2003, ApJ, 585, L59
Kessler-Silacci, J. et al. 2006, ApJ, accepted (astro-ph/0511092)
Malfait, K., et al. 1998, A&A 332, L25
Meeus, G., Sterzik, M., Bouwman, J., Natta, A. 2003, A&A, 409, L25
Przygodda, F., et al. 2003, A&A, 412, L43
Reipurth, B., Chini, R., Krugel, E., Kreysa, E., Sievers, A. 1993, A&A 273, 231
Rodmann, J., Hennig, Th., Chandler, C.J., Mundy, L.G., Wilner, D.J. 2006, A&A, 446, 211
Tanaka, H, Himeno, Y., Ida, S. 2005, ApJ, 625, p414
Wilner, D.J., Bourke, T.L., Wright, C.M., Jorgensen, J.K., van Dishoeck, E.F., Wong, T. 2003, ApJ, 596, 597
Sarah Maddison (Swinburne University), Dave Lommen (Leiden University), Chris Wright (UNSW@ADFA), Tyler Bourke (Harvard-Smithsonian Centre for Astrophysics), Michael Burton (University of NSW), Annie Hughes (Swinburne University), Jes Jorgensen (Harvard-Smithsonian Centre for Astrophysics), Ewine van Dishoeck (Leiden University), David Wilner (Harvard-Smithsonian Centre for Astrophysics) and Huib Jan van Langevelde (JIVE)
(smaddison@swin.edu.au)