Parsec-scale structure and evolution in the radio galaxy Pictor A
Pictor A is one of the very few nearby FR-II type radio galaxies with a core bright enough to study routinely using standard very long baseline interferometry (VLBI) techniques. While not as luminous as Cygnus A, the prototypical FR-II radio galaxy, Pictor A lies well above the FR-I/FR-II luminosity break and is approximately 40% closer than Cygnus A, allowing a detailed high-resolution study of the parsec-scale nucleus and radio jet in a powerful radio galaxy.
Systematic VLBI observations of FR-II type sources are important for testing theories that unify radio sources based on the orientation of their jets relative to the observer. Since the jets of FR-II type sources are supposed to be more in the plane of the sky than directed towards our line of sight, we should expect to find smaller apparent speeds in FR-II jets than in core-dominated radio sources, in which the jets are supposed to be much more aligned with our line of sight. Systematic studies are underway, mainly of FR-II quasars (e.g. Hough et al. 1999; Vermeulen et al. 1993; Hough & Readhead 1989). It is important to add galaxies to these studies so that the statistics are unbiased by orientation.
To study the parsec-scale structure and evolution of Pictor A, VLBI observations were undertaken with the Southern Hemisphere VLBI array, on 1993 July 3, at 8418 MHz with the following antennas: Tidbinbilla (70 m), Parkes, Hobart, ATCA (one antenna), Mopra, Perth (15 m), and Hartebeesthoek. Also, VLBA observations were undertaken on 1999 March 7, at 8391 MHz with seven of the 10 VLBA antennas; the Hancock, North Liberty, and Brewster antennas lie too far north to observe Pictor A.
Figure 1 shows the image from the Southern Hemisphere observations. Figure 2 shows the image from the VLBA observations, using a restricted set of short baselines. Figure 3 shows the full resolution VLBA image. Full details of the data reduction and analysis are given in Tingay et al. (2000).
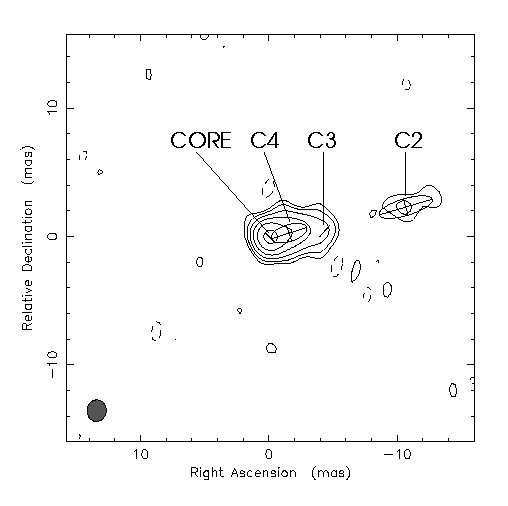
Figure 1: Southern Hemisphere VLBI image from 1993 July 3. Map peak 0.32 Jy/beam, beam FWHM 1.7 X 1.5 mas at _5.1o. Contours start at +/-2.5% of peak and progress in powers of 2.
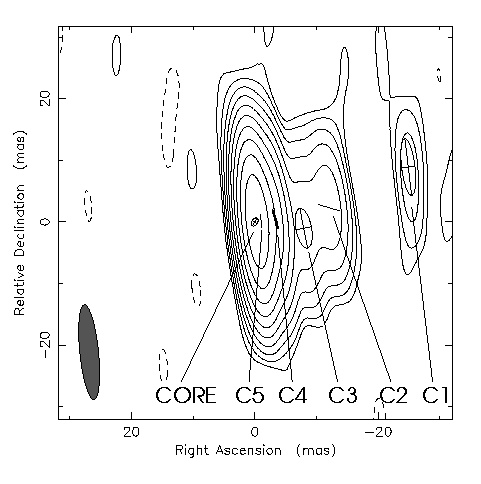
Figure 2: Short baseline VLBA image from 1993 March 7. Map peak 0.72 Jy/beam, beam FWHM 15.5 X 3.0 mas at 5.8o. Contours start at +/-0.1% of peak and progress in powers of 2.
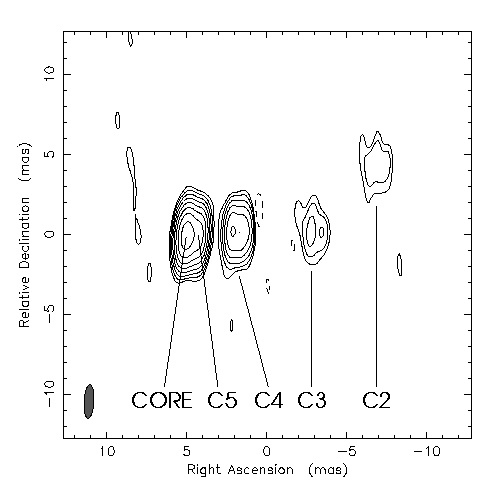
Figure 3: Full resolution VLBA image from 1993 March 7. Map peak 0.40 Jy/beam, beam FWHM 2.1 X 0.6 mas at _3.4o. Contours start at +/-0.5% of peak and progress in powers of 2.
The most plausible identification of components is shown in Figures 1, 2, and 3, indicating that over the 5.6 years between observations, components C2, C3, and C4 have travelled at apparent speeds of 0.5+/-0.4 h-1c, 1.1+/-0.5 h-1c, and 0.4+/-0.7 h-1c, where h is Hubble's constant in units of 100 km/s/Mpc. Further observations will be required to pin down the apparent jet speed more accurately. However, it appears likely that the apparent speed is subluminal or at most only mildly superluminal.
Figures 2 and 3 reveal the existence of an apparent bend in the jet, approximately 10 mas from the nucleus, between components C2 and C3. A hint of the bend is also apparent in the earlier Southern Hemisphere observation. It is unclear whether the apparent bend is due to precession or jet deflection. Both mechanisms have problems when the large-scale structure of the radio source is taken into consideration. If the bend is due to a deflection in a relativistic jet then a simple model predicts that the intrinsic deflection angle be less than 30o (Tingay 1997). If this is the case for Pictor A then it can be inferred that the angle between the initial jet direction and our line of sight is less than 51o (Tingay et al. 2000). The jet angle to the line of sight for Cygnus A has been estimated at greater than 44o (Carilli et al. 1996). Thus, it may be that the Pictor A jet lies significantly closer to our line of sight than that of Cygnus A. A comparison of the optical emission lines from the nuclei of these two galaxies would seem to support this suggestion. Cygnus A has a narrow-line optical spectrum (Tadhunter et al. 1994), whereas Pictor A has broad, variable nuclear emission lines (e.g. Filippenko 1985), indicating that the Pictor A accretion disk may be more face on or less obscured by a dusty torus than that in Cygnus A.
If the jet deflection hypothesis is correct then the large-scale radio jet must undergo additional bending, so that the jet reaches the north-west lobe hotspot. Previous VLA and ATCA images have not determined the properties of the large-scale jet sufficiently well to test this hypothesis. Currently a program of observations with multiple configurations of the ATCA at 20, 13, and 6 cm is aimed at producing the best large-scale images of Pictor A to date, concentrating specifically on revealing the large-scale jet in detail.
Also of interest, in terms of the large-scale jet, is the recent Chandra X-ray observation of Pictor A, which reveals the jet to be a strong source of X-rays. Comparison between the X-ray images and detailed images of the radio jet may help to constrain the X-ray emission mechanism in the jet.
Filippenko, A.V. 1985, ApJ, 289, 475
Hough, D.L. et al. 1999, ApJ, 511, 84
Hough, D.L. & Readhead, A.C.S. 1989, AJ, 98, 1208
Tadhunter, C.N. et al. 1994, MNRAS, 268, 989
Tingay, S.J. 1997, A&A, 327, 550
Tingay, S.J. et al. 2000, AJ, 119, 1695
Vermeulen, R.C. et al. 1993, ApJ, 417, 541
Steven Tingay, ATNF Narrabri