Compact Array millimetre observations of η Carinae
Background
η Carinae is one of the more remarkable objects in the southern sky. Located 2.5 kpc away in one of the Galaxy's most prolific high mass star-forming regions, the Carina Nebula, it underwent an outburst in the 1830s that transformed it from the fifth brightest star in Carina to the second brightest star in the whole sky (magnitude -1). It faded from naked-eye visibility over the next 100 years, but in the 1960s it regained notoriety when it was found to be the brightest (extra-solar system) infrared source in the sky at 10 and 20 µm: the prodigious luminosity previously emitted at optical wavelengths is now absorbed by dust near the star and re-radiated in the infrared. Recently it has been found to be brightening again in the optical (Davidson et al., 1999). At various times it has been explained as a massive pre-main-sequence star, a slow supernova, an accretion-powered source, and a point source of cosmic rays embedded in dust.
The prevailing view for the last 20 years has been that η Carinae is the most extreme member of the class of stars known as "Luminous Blue Variables" (LBVs). These are thought to be evolved massive stars in a short-lived state prior to becoming Wolf-Rayet stars: during this state they shed their outer layers, producing spectacular nebulae. Only a few LBVs are known in our Galaxy. η Car's outburst in the 1830s produced a beautiful dumbbell-shaped nebula, called the "Homunculus", about 17-arcsec long and still growing. As a single star, η Car's bolometric luminosity of 106.5 L would make it possibly the most luminous and therefore most massive star in the Galaxy.
η Car has its own dedicated band of astronomical groupies who meet every few years to drool over the latest excesses uncovered by better and better instruments. Despite all this attention, it was not until about seven years ago that Brazilian astronomer Augusto Damineli realized that some broad optical lines from η Car showed a 5.5-year cycle. This quickly led to the idea that η Car might not be a single 100 M star after all, but rather a binary of two very massive stars in a highly elliptical orbit (Damineli et al., 1997). The primary is an LBV while the companion is apparently a less evolved but hotter star, both with masses in the 40 - 70 M range.
Despite a lot of early scepticism of the binary model (some of which continues), evidence rapidly began to mount in its favour. Coincidentally, X-ray (Corcoran et al., 1995) and radio (Duncan et al., 1995) monitoring of η Car had started a few years earlier and was showing unexpected variability. Damineli predicted a new spectroscopic event at periastron of the binary in early 1998, and a coordinated observing campaign confirmed the periodicity. The X-rays showed a steady rise to a peak as the system approached periastron and then a sudden drop by a factor of 10 to a very low level that lasted for two months (Ishibashi et al., 1999), while the radio showed a quasi-sinusoidal light curve with a very broad peak at apastron and a minimum at periastron (Duncan et al., 1997). These behaviours are attributed to two very different causes: the X-rays are due to a shock where the powerful winds of the two stars collide, and should get brighter near periastron as the distance between the two stars diminishes and the density in the shock goes up. The drop at periastron occurs when the LBV passes in front of the hot star and its dense neutral wind obscures the shock region. The radio emission has a very different source: it is due to free-free emission from gas in the outflow from the LBV that is ionized by ultraviolet photons from the hot companion. However, every 5.5 years when the binary orbit causes the evolved star to pass close to the hot star, the dense LBV wind absorbs all the ultraviolet light and shuts off the supply of ionizing photons to the gas, which is dense enough to recombine (becomes neutral again) on a short timescale and thus ceases to emit radio waves. As the evolved star moves further on its orbit, the hot star is revealed once again and the process starts all over.
Compact Array millimetre observations
With this background, we looked forward with great excitement to the opportunity to use the Compact Array at millimetre wavelengths during the periastron event in 2003 (roughly coinciding with the IAU GA!). Millimetre wavelengths allow us to address a number of aspects of this system that complement the results of the long-term microwave monitoring with the Compact Array, particularly by taking advantage of the superior spatial resolution and ability to look deeper into the system (because the height of the optically-thick surface in a stellar-wind radio source scales with radio frequency ν as ν -0.7). A European group used the SEST telescope to look at the millimetre emission of η Car and found several remarkable results: at λ = 3 mm the flux of η Car was found to be 10 - 20 Jy, which is an extraordinary continuum level; it varied with the 5.5-year cycle; and in addition η Car was found to exhibit strongly masing recombination lines (Cox et al., 1995; Cox, 1997). Theory says that such masing recombination lines require regions of very high density where collisions overpopulate the upper energy levels of hydrogen atoms (Strelnitski et al., 1996), so an obvious source for the line is the wind of the LBV. This offered the prospect of measuring the velocity shift in the LBV on either side of periastron and providing definitive support for the binary hypothesis if a change in velocity should be detected. The SEST-data are single-dish measurements and contain no information on the spatial structure of the source, but we knew from the microwave observations that the source region would be just a few arcseconds across, perfectly matched to the Compact Array's longer configurations. With periastron predicted (correctly, as it turned out) for June 2003, we requested observations at both 12 and 3 mm in early May and early August, on either side of periastron. Based on models for the binary orbit, the LBV should show a velocity change of order 50 km/s, easily detectable at both wavelengths.
η Car is a wonderful millimetre source, with a large flux packed into a very small region, making it ideal for self-calibration and therefore less susceptible to atmospheric problems than weaker sources. Only three antennas were available at 3 mm but all six antennas were outfitted with the 12-mm receivers for both of our observations. With the exception of one very brief period in the middle of an afternoon, none of our data showed atmospheric decorrelation of the amplitudes and it produced excellent results.
Figure 1 summarizes the results of the 3-mm observations. The three-antenna data are consistent with a source smaller than 1 arcsecond. In May the continuum flux was 8.6 Jy and the recombination line was 8 Jy brighter, dominated by the feature at -55 km/s (i.e., blue-shifted). By August the continuum level had dropped by about a factor of over 3 to 2.4 Jy, but the line flux fell even more dramatically, by almost a factor of 10. However, the velocity of the line showed no change: it was still centered at -55 km/s. Our results do not show a velocity shift consistent with motion of either the LBV or its companion around their orbits.
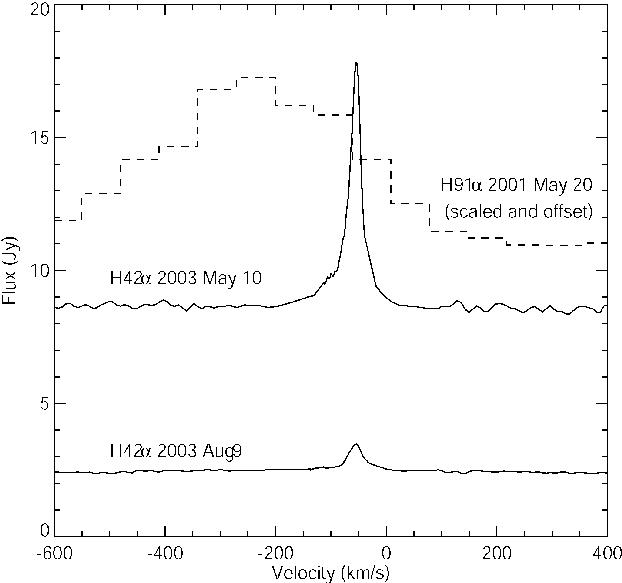
Figure 1:Compact Array observations of the H42α recombination line (85.688 GHz) and continuum spectrum of η Carinae obtained with the 3-mm receivers on either side of periastron in May and August, 2003 (solid lines, labelled). Two correlator settings are required to achieve the broad velocity coverage. The flux scale is correct to better than 10%. For comparison, we show the microwave recombination line H91α (8.585 GHz) spectrum in 2001 (dashed), near apastron for the system, arbitrarily shifted and rescaled for the plot. The other famous masing recombination line source, MWC 349, shows two peaks in the spectrum, spatially offset from one another and apparently from opposite sides of a disk surrounding a hot star, very different from the single peak exhibited by η Car.
For comparison, Figure 1 also shows the microwave recombination-line spectrum at apastron: it is very different from (and much weaker than) the millimetre spectrum, with a feature 500 km/s wide centered at about -250 km/s. The microwave spectrum is dominated by optically-thick gas at large distances from the system, blueshifted because it is flowing out from the stars and lies between us and them. This gas becomes optically thin at higher frequencies and is not visible in the millimetre emission, which reveals instead a bright source closer to the stars.
The dramatic changes in flux levels at 3-mm wavelength are consistent with the SEST results and with 7-mm measurements from the Itapetinga single-dish telescope in Brazil, but are very difficult to reconcile with a stellar wind model. The LBV, with its slower but more massive and hence much denser wind, should be a very bright radio source if its wind is ionized. However, assuming that ionization in the wind is due to the LBV's own radiation field, there is no reason for it to vary dramatically with orbital phase. On the other hand, if the millimetre continuum source is a region of the dense LBV wind ionized by the hot companion (as in symbiotic stars), its flux should diminish at apastron when the companion is far away, which is the opposite of the observed behaviour. Since everything else in the system seems to fit the binary model so well, we conclude that the recombination line source does not lie in the wind of either star. There are other discrete dense gas concentrations known to exist within the central 1 arcsec of the system (the projected size of the binary orbit is about 5 milli-arcseconds), but none of them have the right velocity, and it is hard to understand how they could be brighter in the radio than the LBV stellar wind. Note that the hot companion in the system has never been detected directly at any wavelength.
The recombination line is also masing at 12 mm and velocity measurements at that wavelength support the 3-mm results. However, much less change from May to August is seen in the 12-mm fluxes, which dropped about 30%. This implies that the millimetre spectrum of η Car changes slope significantly near periastron. With six antennas and plenty of flux, we can take advantage of super-resolution techniques to achieve sub-arcsecond imaging at 12 mm. Figure 2 compares the 12-mm image at 0.15-arcsec resolution in August with an image at 3 cm obtained a few days earlier and with the 12-mm image in May (greyscale).
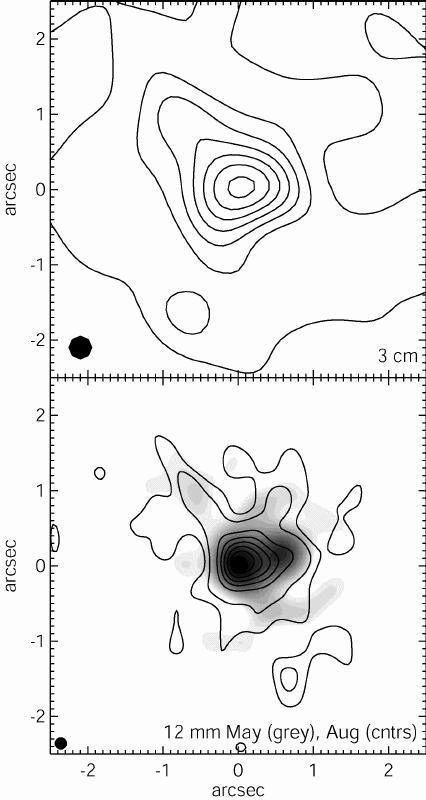
Figure 2: Compact Array images of the continuum emission from η Carinae at 3 cm in 2003 August (upper) and at 12-mm (lower: 2003 May image in greyscale, August in contours) wavelengths. These are super-resolved images deconvolved using maximum entropy with restoring-beam sizes as shown in the bottom left corner (0.3 arcsec at 3 cm, 0.15 arcsec at 12 mm). Contours are at intervals of 2, 5, 20, 35, .., 95% of the maxima (32 mJy/beam at 3 cm, 61 mJy/beam at 12 mm). At the normal resolution (0.7 x 0.4 arcsec) the August 12-mm image has a peak-to-rms ratio of almost 2000.
The 12-mm images are much more centrally condensed than the 3-cm image, although they also exhibit some of the fainter outlying features present in the 3-cm image, such as the faint linear feature pointing to the north-east. This central condensation at the shorter wavelength is consistent with the expected picture in which the size of the optically-thick surface decreases with wavelength such that we see deeper into the central region of the source. However, the 12-mm image is still clearly extended at the resolution used in Figure 2. In May a discrete peak is seen 0.6 arcsec to the west of the brightest peak, and in August this western source appears much weaker, while the main peak is almost unchanged, suggesting that it may be a stable stellar-wind source.
These observations demonstrate the power of the new millimetre receivers on the Compact Array: sensitive sub-arcsecond images of southern sources can readily be achieved. However, they have only deepened the mystery surrounding η Carinae. We look forward to having five antennas outfitted with 3-mm receivers to allow us to peer even deeper into the central region. As the system recedes from perihelion, the millimetre fluxes will again grow and the images will reveal the distribution of gas that becomes ionized as the LBV departs.
References
Corcoran, M., Rawley, G. L., Swank, J. H., & Petre, R. 1995, ApJL, 445, L121
Cox, P. 1997, in ASP Conf. Ser. 120: Luminous Blue Variables: Massive Stars in Transition, 277
Cox, P., Mezger, P. G., Sievers, A., Najarro, F., Bronfman, L., Kreysa, E., & Haslam, G. 1995, A&A, 297, 168
Damineli, A., Conti, P. S., & Lopes, D. F. 1997, NewA, 2, 107
Davidson, K., Gull, T. R., Humphreys, R. M., Ishibashi, K., Whitelock, P., Berdnikov, L., McGregor, P. J., Metcalfe, T. S., Polomski, E., & Hamuy, M. 1999, AJ, 118, 1777
Duncan, R. A., White, S. M., & Lim, J. 1997, MNRAS, 290, 680
Duncan, R. A., White, S. M., Lim, J., Nelson, G. J., Drake, S. A., & Kundu, M. R. 1995, ApJL, 441, L73
Ishibashi, K., Corcoran, M. F., Davidson, K., Swank, J. H., Petre, R., Drake, S. A., Damineli, A., & White, S. 1999, ApJ, 524, 983
Strelnitski, V. S., Ponomarev, V. O., & Smith, H. A. 1996, ApJ, 470, 1118
Stephen White, Bob Duncan, Jessica Chapman and Baerbel Koribalski
(Stephen.White@astro.umd.edu)