Compact Array traces the frequency drift and temporal structure in coherent stellar emission
We have known for some years that certain active binary stars and flare stars occasionally emit highly circularly polarized radiation at L and S-bands (at 20 and 13 cm); this emission implies that the electrons responsible are not being accelerated in the random manner that characterizes synchrotron radiation, but in a much more ordered fashion that results in the source having high polarization and high brightness. Examples of coherent emission occur in the most common bursts from the Sun, and the nearest star, Proxima Centauri, was recently found to emit coherent radiation for as long as two days (Slee et al. 2003). Coherent emission comes in two main flavours, plasma emission and electron-cyclotron maser emission (ECME); both types are highly polarized, but they differ in that ECME has much finer time-resolved structure with burst durations in the millisecond range.
Up until now, the large synthesis arrays such as the VLA and the Compact Array have had sufficient sensitivity to detect coherent emission, but insufficient time-resolution to discriminate between plasma and ECME. During 2004 we managed to set up the correlator of the Compact Array to deliver samples at a rate of 12.8 samples per second, which is 128 times faster than that used for earlier work on stellar emissions. Mark Wieringa also modified the on-line display software (VIS) to show the flux density of circular polarization; this permitted us to switch to the high sampling rate only at times when the polarization was high enough to yield useful results. We observed with this modified system on 28 March and 8 April 2005, and on both occasions we were lucky enough to catch the well-known RS CVn binary HR 1099 in a coherently emitting state. Here we shall describe our results of 28 March.
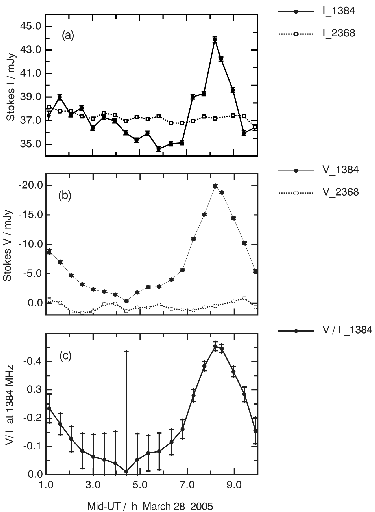
Figure 1: Plots of 25-min integrations against UT on 28 March 2005. Total intensities (Stokes I) at 1.384 and 2.368 GHz are in panel (a); circularly-polarized intensities (Stokes V) at 1.384 and 2.368 GHz are in panel (b); the polarized fraction (V/I) at 1.384 GHz is shown in panel (c).
We observed HR 1099 with the Compact Array in a 6-km configuration for ten hours, recording simultaneously at 1.384 and 2.368 GHz with the usual integration time of 10 s. The flux density measurements are shown in Figure 1, in which the total flux, I is seen in panel (a), the circularly polarized flux, V in (b) and the polarized fraction, V/I in (c). Figure 1 shows that there was a moderate amount of polarized flux in the first hour, but it was not considered strong enough to initiate the high sampling rate. However, beginning at 06 h the polarized fraction rose rapidly at 1.384 GHz, reaching a peak near 08 h UT. The high sampling rate in V was initiated just after this peak for about 20 minutes. The 2.368-GHz polarization remained slightly positive, i.e. polarized in the right-handed sense over the 10-hour run; this is the normal state of polarization for synchrotron emission from this star.
Our first step in the analysis was to elucidate the temporal structure in the highly time-resolved data. We did this by allocating the data to 40, 10, 2.5, 0.625, 0.156 and 0.078-sec bins, We found the variance in flux-density between the samples in each bin, var (b); we also found the average variance within each sample in a bin, var (w) (this is due mainly to system noise). By subtracting var (w) from var (b) and taking the square root, we now have the root-mean-square (rms) variation in flux-density due to the coherent source only; then dividing the rms by the average value of V yields a modulation index, m = Vrms/ |V|. These values of modulation index are plotted against bin size in Figure 2, which demonstrates that the intrinsic variability is still increasing at the limit of our time resolution (0.078 milliseconds). It seems clear, therefore, that the coherent emission from HR 1099 is ECME and not plasma emission.
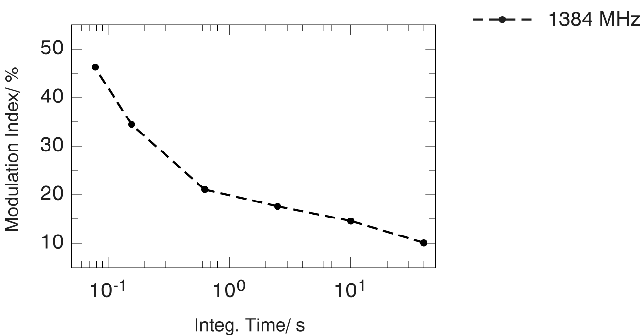
Figure 2: The modulation index at 1.384 GHz (see text for definition) is plotted against the six integration times; this data comes from the high-time resolution Stokes V data taken at 08:28 UT near the peak of the coherent emission.
We next investigated the spectral structure of the ECME, i.e. how the flux density changes with frequency. The IF output of the Compact Array consists of 13 contiguous channels, each 8-MHz wide, permitting us to show the radio spectrum over a total width of 104 MHz. Figure 3 shows the spectra, each of which is derived from one of the 25-min integrations shown over the peak of circular polarization in Figure 1. We are obviously seeing narrow-band peaks that slowly drift across the 104-MHz bandwidth of the receiver. Beginning at 06:48 UT on the top left of Figure 3, we note that the peak with bandwidth about 30 MHz drifts to lower frequencies at about 0.7 MHz per minute, disappearing off the low-frequency end at just after 07:44 UT. As the first peak disappears, a second peak of emission has already appeared at the high-frequency end of the spectrum; this peak has a larger bandwidth of about 45 MHz and drifts to lower frequencies at about the same rate of 0.7 MHz per minute, finally beginning to disappear off the end of the spectrum at 09:26 UT. It is clear from the values for V/I in Figure 1c that the maximum polarized fraction, when averaged over the 25-min integrations from which Figure 1 is constructed, reached about 45% at UT's of 08:08 and 08:28. However, because of narrow band emission, these same integrations contained peak values of V/I of about 100%, and minimum values of less than 10%. The instantaneous bandwidth of the ECME can be lower than 2% of the operating frequency centred on 1.384 GHz, especially when the frequency drift during each integration is taken into account.
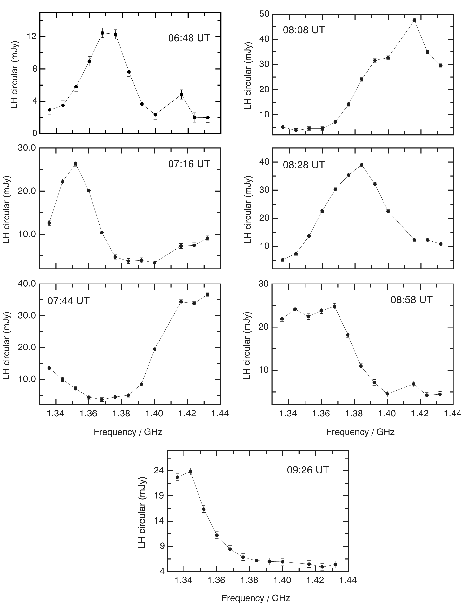
Figure 3: Spectra of the 1.384 GHz circularly-polarized intensity (V) from the seven 25-min integrations over the peak in Figure 1. The frequency range is defined by the bandwidth of the receiver. The peak fractional polarization is near 100% at 08:08 and 08:28 UT. The highly time-resolved data were taken during the integration at 08:28.
The theory of ECME has been summarized recently by Melrose (2005), and further theoretical details are given in connection with the ECME detected from Proxima Centauri by Slee et al. (2003). ECME has been detected from a variety of sources including the Sun, Jupiter, close binary stars, flare stars and the Earth's aurorae; this form of emission is generated by celestial objects with very different magnetic field strengths and plasma densities. While many of the details of ECME are yet to be satisfactorily explained, it seems to be well accepted that the emission that reaches the observer is the second harmonic of the gyro-frequency, i.e. the frequency at which injected electrons gyrate around magnetic field lines. Thus ECME emission near 1.4 GHz implies a source region field strength of 250 G, while the plasma density needs to be less than 6 × 10⁹ electrons cm-3 if the radiation is to escape from the source to the observer. Our observation that narrow-band ECME bursts, each composed of fine structure of duration less than 78 milliseconds, drift slowly to lower frequencies, introduces another parameter that needs to be explained. A frequency drift in the observed sense suggests that the emitting electrons may somehow drift slowly across magnetic field lines to lower field intensities further out in the corona of HR 1099. At present we have little idea of how long these drifting narrow-band sources can retain their identities.
Acknowledgements
We thank Mark Wieringa for his modifications to the VIS software, and Vince McIntyre for software that was essential for the analysis of the high-time resolution data.
References
Melrose, D., 2005, Pub. Astron. Soc. Aust., 22, 144
Slee, O.B., Willes, A.J. & Robinson, R.D., 2003, Pub. Astron. Soc. Aust.,20. 257
Bruce Slee (CSIRO ATNF), Warwick Wilson (CSIRO ATNF) and Gavin Ramsay (Mullard Space Science Laboratory / University College London)
(Bruce.Slee@csiro.au)