The Compact Array Galactic Centre ammonia survey

Figure 1: Compact Array ammonia (1, 1) peak intensity map of the Galactic Centre Region (logarithmic representation). The map consists of 840 individual pointings. Sgr A*, the massive central black hole of the Galaxy is located toward the right of the map (see also Figure 3). The very prominent emission to the left is emitted by Sgr B2. Notable are also the two `holes' on top of Sgr B2 which exhibit ammonia in absorption.
The Galactic Centre Region (GCR) is the most nearby core of a galaxy. A large number of very different features are present in the GCR, e.g., the central black hole in Sgr A* and its circumnuclear disc, as well as a variety of massive star forming regions such as Sgr B2 and Sgr B1 which exhibit quite different morphologies and kinematics. The region is furthermore subject to extreme physical conditions such as shear, magnetic fields, and strong tidal forces. For a reliable understanding of the physics involved in galactic cores a large number of direct measurements of parameters such as the density and the temperature of different gas phases is indispensable.
Owing to its particular tetrahedral structure, transitions of ammonia can be used as a perfect thermometer for dense molecular gas. This property is the main driver for the wide-field Compact Array ammonia survey toward the Galactic Centre. A few weeks ago we observed the first part of the Galactic Centre Region stretching from the central black hole, Sgr A* to the massive star forming region, Sgr B2. Here, we present the first results of this survey, which covers an area 1° × 0.2° in size. The observations were made using the ultra-compact H75 array configuration and demanded mosaicing of 840 pointings to cover the large field. Both, the metastable ammonia (1, 1) and (2, 2) inversion lines were measured simultaneously. The resulting map, displayed in Figure 1, has a physical resolution of ~1 pc (synthesized beam ~20 arcsec) and is the most detailed, wide-field map of molecular gas toward the Galactic Centre Region to date. Over most of the regions we find a very good correspondence between the ammonia features and the dust distribution. Toward Sgr B2 we observe ammonia in absorption against the bright radio continuum flux. The absorption spectra, as well as some emission lines exhibit multiple line components indicating a rather complex distribution of the molecular gas.
The ammonia (1, 1) and (2, 2) inversion lines trace a Boltzmann distribution and therefore the temperature of the gas. This temperature, called "rotational temperature" can be converted into kinetic temperature by applying radiative transfer models. At high temperatures, however, the ratio of line strengths exhibits only slight variations and, therefore, the (1, 1) and (2, 2) rotational temperature is a tracer for cold gas. Quantitatively, rotational temperatures up to ~30 K correspond well to kinetic temperatures, while higher rotational temperatures indicate a very hot environment.
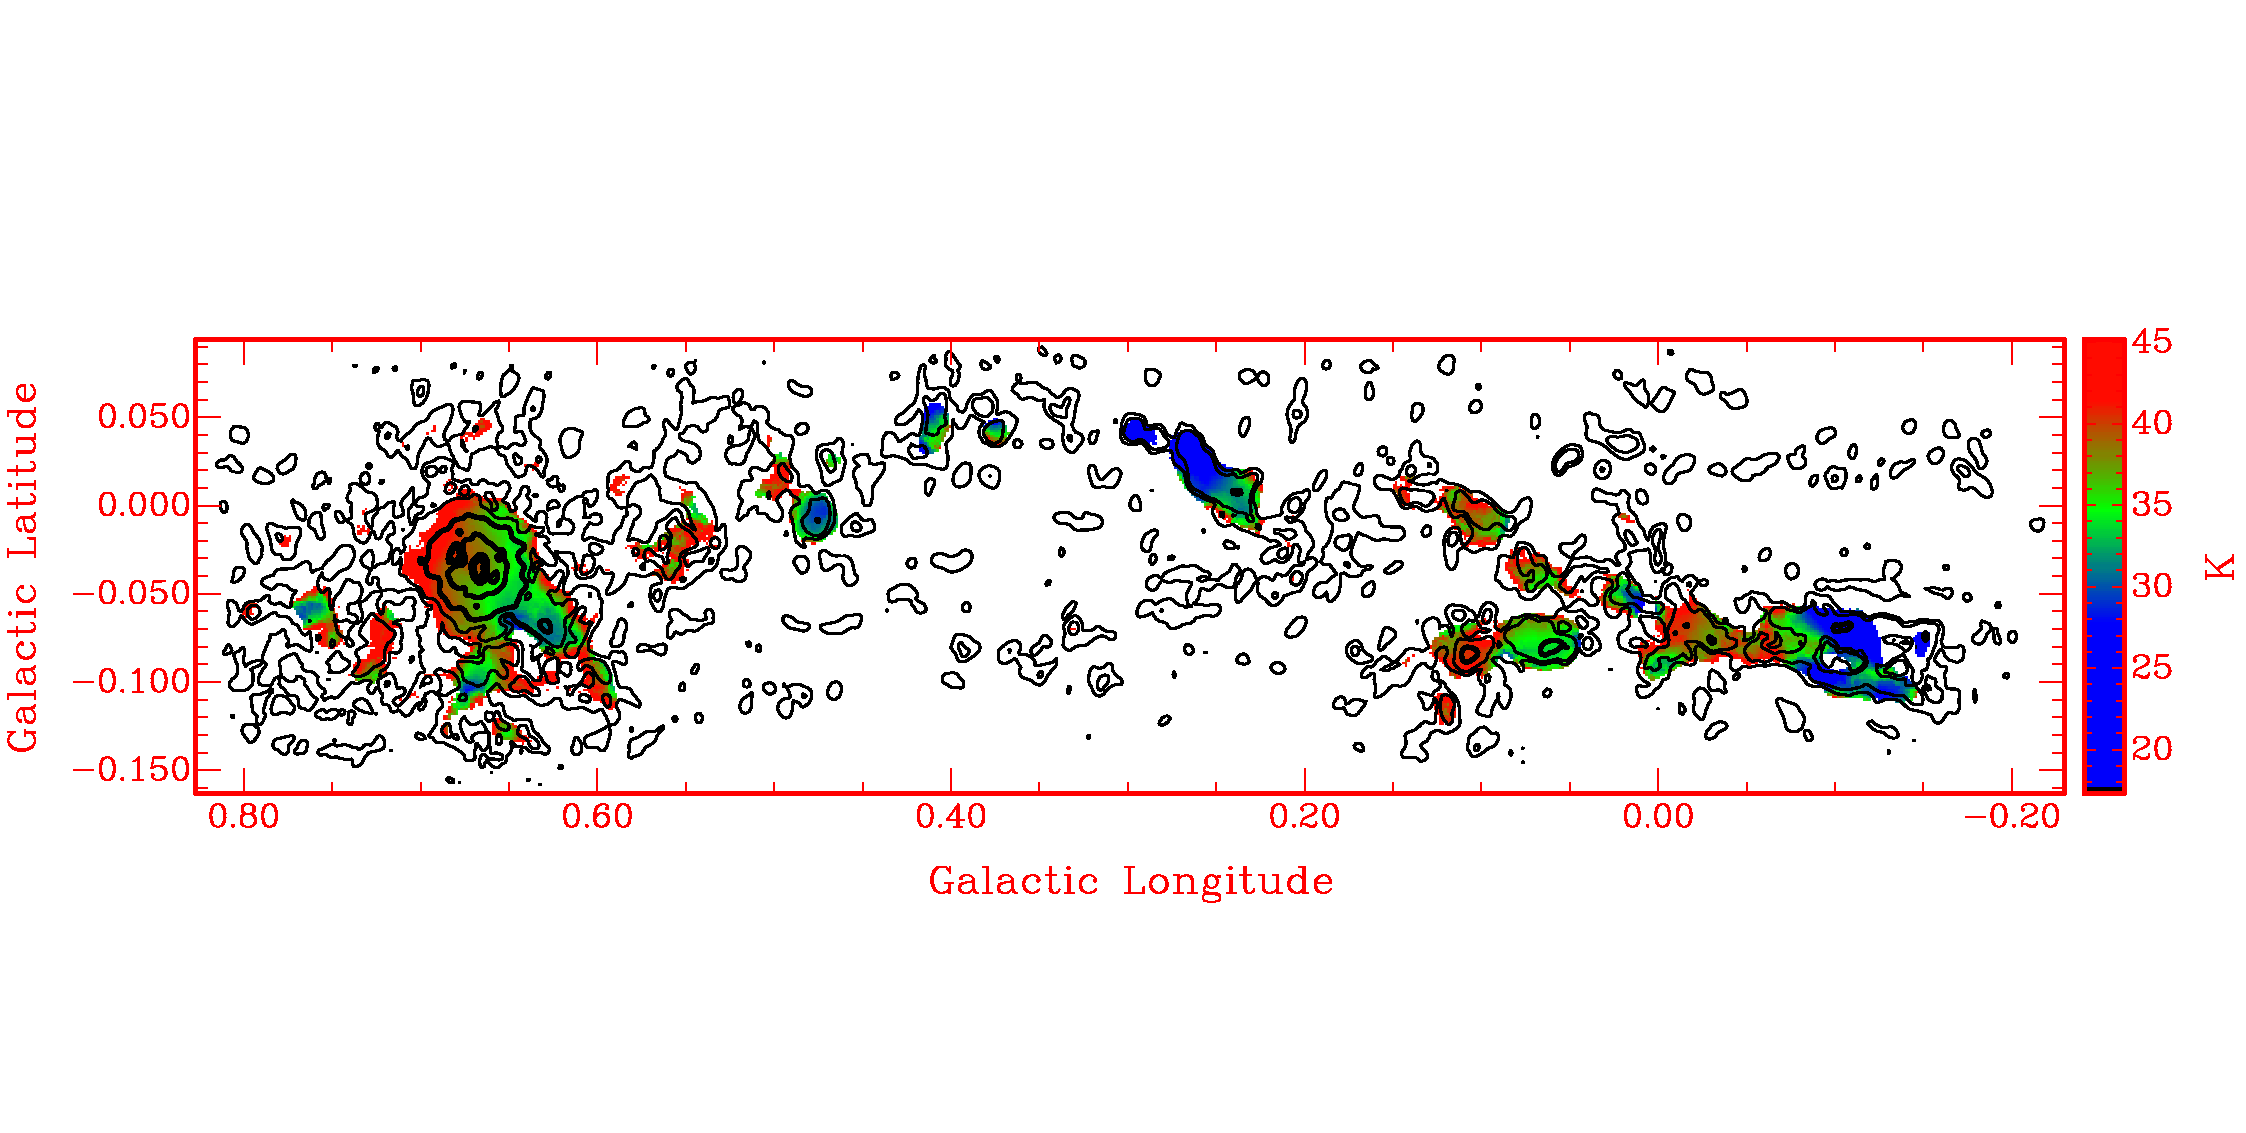
Figure 2: Rotational temperature map of the Galactic Centre (logarithmic representation). Cool molecular clouds are displayed in blue (cold) and red (hot). Contours of the ammonia peak flux distribution are plotted on top.
In Figure 2 we show a preliminary temperature map of the Galactic Centre Region. In the molecular gas south of Sgr A* and in the arc-like region between Sgr A* and Sgr B2, the temperature is ~20 – 30 K, significantly lower than at other positions. Across Sgr B2, the molecular gas shows a clear temperature gradient with cooler gas towards the Galactic Centre.
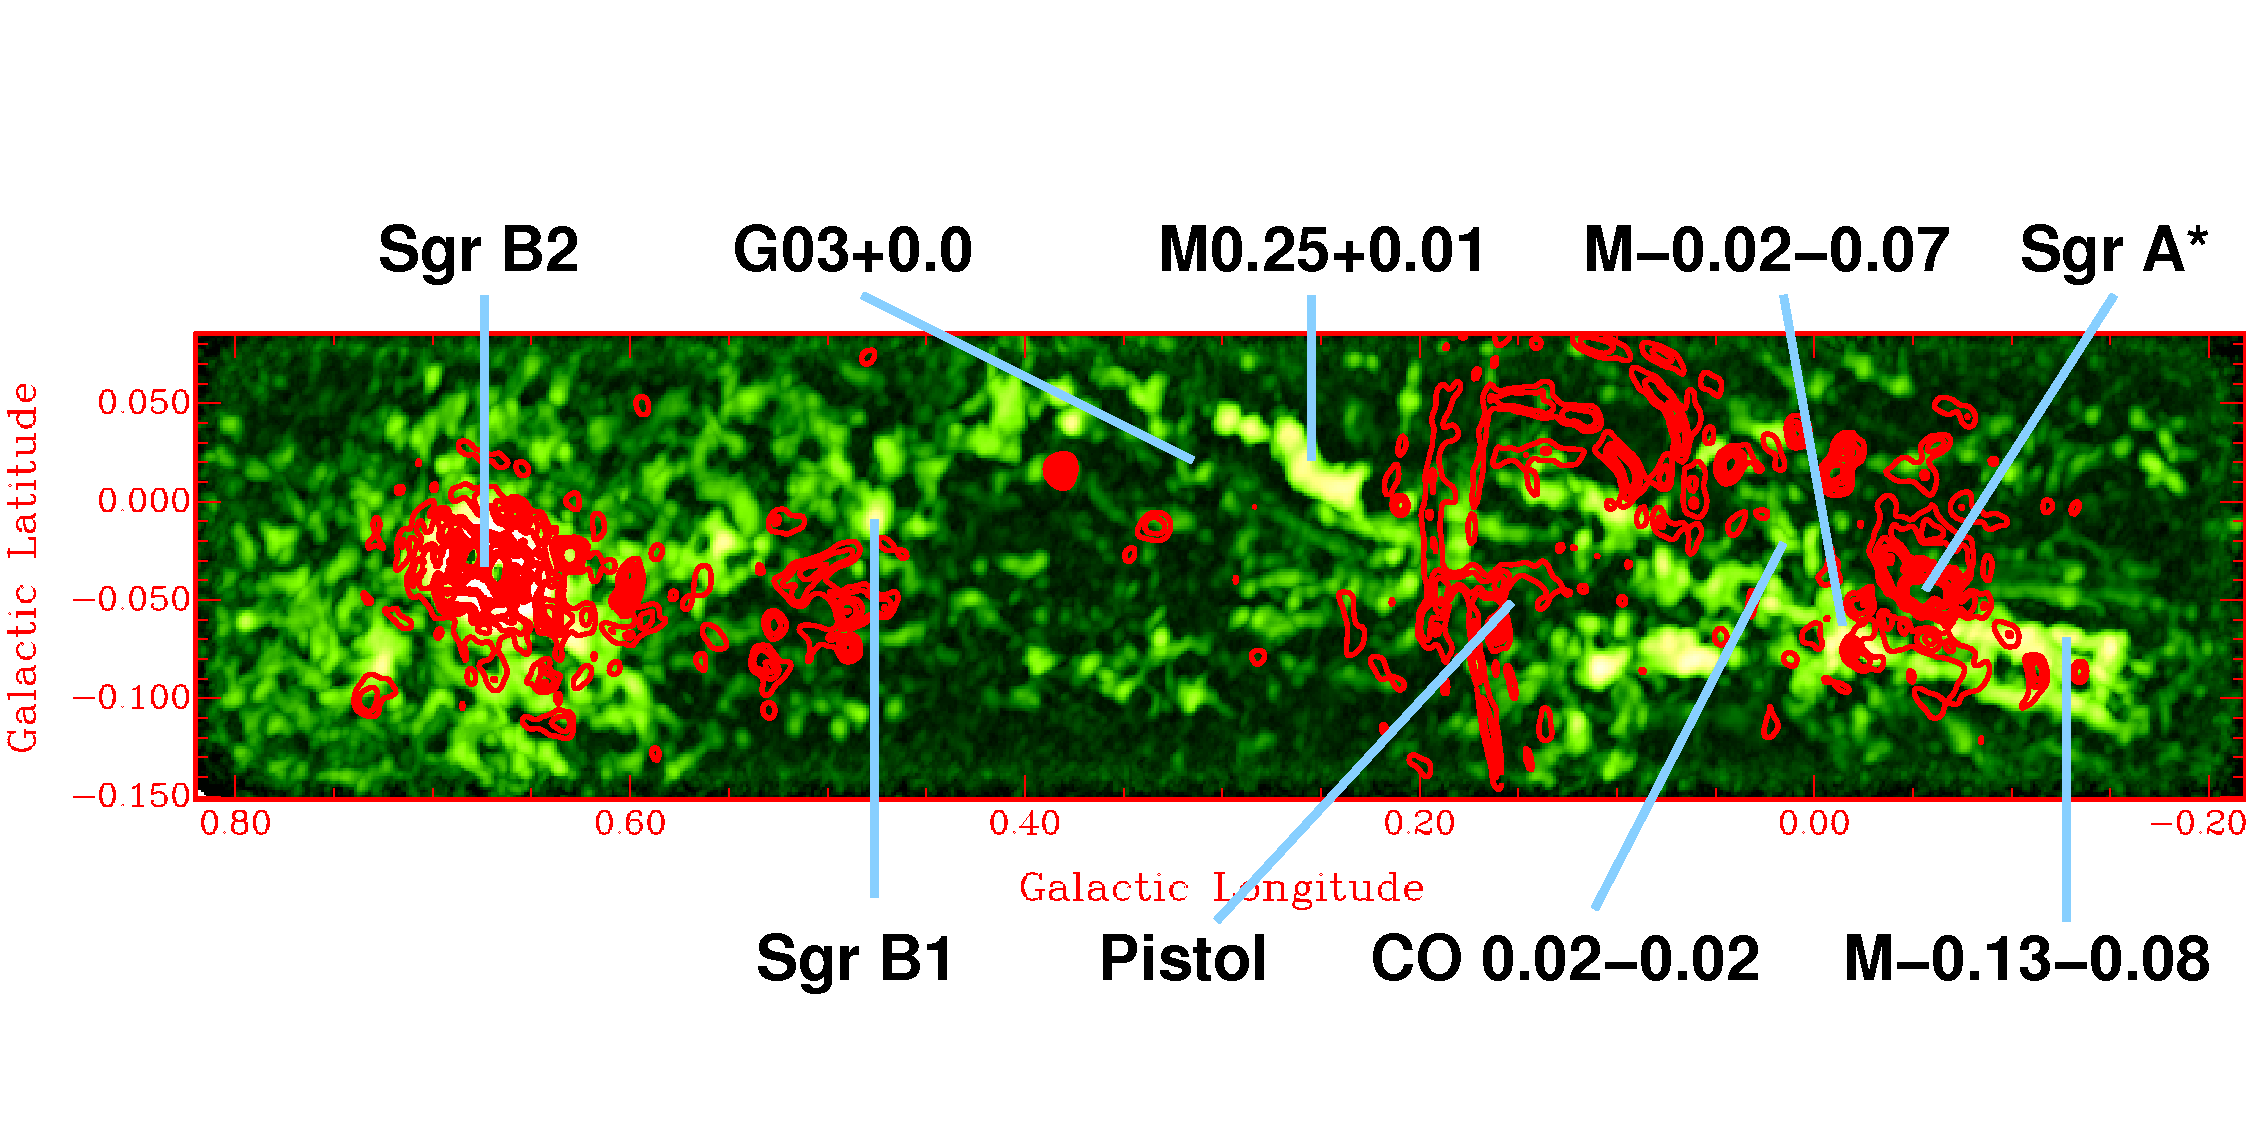
Figure 3: 12-mm radio continuum map overlaid as contours on the ammonia distribution (logarithmic representation). Some of the most prominent features of the region are labelled. Note the very thin, prominent radio continuum filaments around the Pistol region.
In addition, we also obtained the first wide-field 12-mm continuum map (Figure 3). This clearly displays the well-known filaments close to the core of the Milky Way, e.g., the prominent thin radio filaments perpendicular to the Galactic plane and the "mini-spiral" around Sgr A*. A comparison of the ammonia temperature map indicates that the gas may be somewhat warmer in regions where the radio continuum is prominent.
The full analysis will encompass virial masses of individual clouds, the clump mass-function down to the lowest masses ever determined in the GCR, and more detailed temperature and pressure maps. In addition, a wealth of observations of all wavelengths is available for the Galactic Centre which will be compared to our data in terms of heating / cooling mechanisms and within large velocity gradient radiative transfer models. The data presented here also forms a cornerstone for the comparison with molecular gas properties within the cores of other galaxies.
Juergen Ott (ATNF), Lister Staveley-Smith (ATNF), Christian Henkel (MPIfR Bonn, Germany) and Axel Weiss (MPIfR Bonn, Germany)
(Juergen.Ott@csiro.au)