The Colour of Stars
Astronomy is full of colour references; white dwarfs, black holes and red giants for example. If you look up into the night sky you may be able to see a few thousand stars from a dark site. As the stars are all so distant they appear as points in the sky. Most appear white but a few stars such as Antares and Betelgeuse have an orange or reddish hue to them. Others such as Rigel suggest a bluer colour. The colours of stars, however, are not obvious in most stars for several reasons discussed below. Colour is nonetheless an important and useful property of stars. In this page we will look at how it is defined, measured and used in astronomy.

A starfield in the region of Sagittarius showing stars of different colours.
Stellar Colours
The photo above shows a small section of a starfield in Sagittarius taken by the HST from space. The variety of colours of the stars is immediately obvious. Colours vary from bluish-white through to red. Why do stars have different colours?
The colour of a star is primarily a function of its effective temperature. You should recall that a star approximates the behaviour of a black body radiator. As a black body gets hotter its colour changes. If you were to heat a solid shot put it would first emit radiation in the infrared region. Further heating would see it glow a dull reddish colour. With more heating it could eventually glow orange, yellow, white and eventually blue-hot. Ultimately if it were hot enough a black body emits most of its energy in the ultraviolet region. Although stars are not perfect black bodies this relationship between temperature and colour still applies to them.
The colour that we see is usually an additive combination of the emissions from each wavelength. Hot stars appear blue because most energy is emitted in the bluer parts of the spectrum. There is little emission in the blue parts of the spectrum for cool stars - they appear red. Even though the Sun's peak emission wavelength (Wien's Law) corresponds to the green part of the spectrum, its colour appears pale yellow due to the relative contributions of the different parts of its Planck curve to the overall colour. The table below shows the approximate colour and temperature range for stars.
| Spectral Class | O | B | A | F | G | K | M |
|---|---|---|---|---|---|---|---|
| Temperature (K) |
50,000 - 28,000 | 28,000 - 10,000 | 10,000 - 7,500 | 7,500 - 6,000 | 6,000 - 4,900 | 4,900 - 3,500 | 3,500 - 2,000 |
| Colour |
Blue
|
Blue-
white |
White
|
White-
yellow |
Yellow
|
Orange
|
Red
|
(The colours shown in the above table are the correct hexadecimal codes for rgb monitors based on details from M. Charity at MIT. They represent the colour from an extended gas disk and not a point source. For more a detailed discussion visit his website.)
Even though stars have different colours, our perception of stellar colours in the night sky is poor. The reasons for this are discussed next.
Human Vision
Our eyes are extremely sensitive detectors of visible photons. Only a few incident photons are needed to trigger a stimulus response in our eyes. Why then do we not see star colours more readily? There are in fact several reasons:
- Cones and Rods: Our eyes have two types of photoreceptors; rods and cones. Rods are more abundant (120 million) and sensitive than cones and have a higher proportion around the edges of the retina. They cannot see colour rather they perceive grayscale. Rods are very unresponsive to red light. Cones are less sensitive than rods and more clustered near the centre of the retina. Three types; red, blue and green make up the 7 million cones in a human eye. Being less sensitive than rods, cones require many more incident photons of the right frequency to trigger them. This is the main reason why we do not see colour at night.
- Stars as point sources: The vast distance to stars means we cannot resolve them as disks, instead we see the light from a point source. Our eyes are relatively insensitive to colour from point sources. The technical term for this effect is small field tritanopia. An interesting analogy of this effect can be seen in photographs of stars on colour film. The colour is hard to distinguish when the stars are focused but if the camera is defocused so that the stars' light is spread into discs their colours become more apparent as is seen in the photo below by David Malin of the constellation Orion. Here the untracked camera has been increasingly defocused over time so that instead of narrow star trails the starlight is spread out.
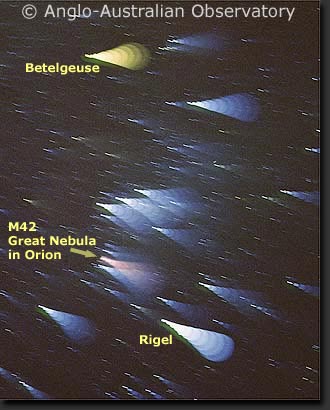 Defocused star trails showing the colour of prominent stars in Orion. Compare the colours of the M-class Betelgeuse with the B-class Rigel. Notice the distinctive pinkish colour of the emission nebula M42.
 - Pupil size: At night our pupils dilate to let the dim light in. The resulting large aperture of the lens degrades image quality and produces chromatic aberration where we can see coloured haloes around objects.
- Dark adaptation - the Purkinje effect: Our photoreceptors become more sensitive in faint light over time. Cones adapt in about 7 minutes whilst rods take half an hour to reach maximum sensitivity. Cones still remain far less sensitive than rods but as rods are much more sensitive to blue light than red light we perceive dim light as bluer than it actually is. This effect is called the Purkinje effect. One implication for visual astronomy is the tendency to underestimate the brightness of red stars.
Even if we use other detectors such as photographic plates or CCDs to detect light from stars rather than our eyes the colour recorded may not be the "true" colour of the star for other reasons.
Interstellar Reddening and Extinction.
Interstellar space is not a perfect vacuum. The interstellar medium (ISM) comprises cold neutral gas (H I at ≈ 70 K), warm neutral gas (H I at 6,000 K) and hot ionised plasma (H II at 106 K) primarily located in the plane of the galaxy in the spiral arms. Cosmic dust is made up of small grains of silicates, iron, carbon, frozen water and ammonia ice 0.1 to 0.01 microns (μm) in size. Although this cosmic dust only makes up 1% of the mass of the ISM it absorbs and scatters light from stars. This means that light from a distant star is reduced in intensity so that the star appears dimmer than it would be if there were no intervening material. Termed extinction this effect can be estimated if the distance to the star and its position relative to galactic arms and molecular clouds is known. In general more distant stars suffer greater extinction or reduction in brightness than nearby stars.
Extinction is inversely proportional to wavelength so red light is less affected than blue light. Distant stars thus appear more red than they actually are. This interstellar reddening must be compensated for in trying to determine the true colour and brightness of a star. If a star's spectral and luminosity classes are known its absolute magnitude and colour can be inferred. By measuring its apparent colour the amount of reddening can be determined and this can then be used to determine an approximate distance to the star.
Infrared and radio waves have even longer wavelengths than red visible light and can travel through the ISM relatively unimpeded hence they provide useful information about processes occurring within molecular clouds and galactic arms.
Metallicity
Red giants such as Betelgeuse are not actually that red in colour. If you look at the colour in table 4.3 above you can see that its actual colour would be more orange than true red. A small group of stars do, however, appear deep red. These are the carbon stars such as 19 or TX Piscium. These ruby-red coloured stars have high abundances of carbon molecules such as C2, CH and CN in their outer layers that absorb most of the photons in the blue and violet parts of the spectrum. Carbon stars were traditionally classified as R and N classes with similar temperatures to K and M stars respectively. Nowadays they are collectively referred to as type C (for Carbon).
Measuring Colour - Colour Index
In order to use the colour of a star astronomers first need to define it and then have a way to measure it. Luckily there is a simple way to do both that relates back to the spectrum of a star. A typical star's spectrum approximates a Planck curve. This means the intensity of emitted energy varies with wavelength such that a hot star emits relatively more energy at blue wavelengths than at red whilst a cool star's emission peaks at red wavelengths. If the intensity is measured at a specific wavelength or narrow waveband then it can be compared with intensity at other narrow wavebands. The intensity is expressed as apparent magnitudes.
Rather than just have one apparent magnitude, m measured across the entire visible spectrum we can use a filter to restrict the incoming light to a narrow waveband. If, for instance, we use a filter that only allows light in the blue part of the spectrum, we can measure a star's blue apparent magnitude, mB. This is generally abbreviated to B. A blue filter provides a waveband similar to the maximum sensitivity of most photographic film which peaks at blue wavelengths of around 440 nm (which is why red lights are used in darkrooms). Similarly if we use a filter that approximates the eye's visual response which peaks in the yellow-green part of the spectrum we measure mV or V for a star.
This system of measuring magnitudes at two different wavebands, B and V forms the basis of defining the "colour" of stars. Rather than use words such as red or orange, astronomers define the colour of a star to be its colour index. Colour index or CI is simply a number equal to the difference between the blue, B and visual, V magnitudes of a star. This is shown by equation 4.9:
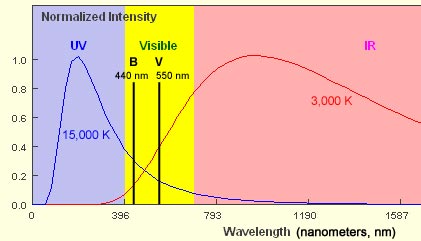
How does this apply in practice to stars? Let us look at two different stars, one with an effective temperature of 15,000 K and the other of 3,000 K. Each of these will produce a spectrum that approximates a black body curve. The diagram below shows these two curves on a normalised intensity plot (if we used a true intensity scale the plot for the 3,000 K star would be dwarfed by that for the hotter star). You can see that in the visible part of the spectrum the curve is sloping down to the right for the 15,000 K star whilst it slopes up for the cooler star. The two black lines represent the peak wavelengths for the B and V filters.
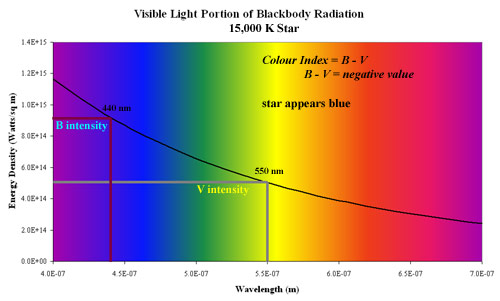
The blue curve represents the 15,000 K star. It emits more energy in the B waveband than in the V waveband. This means that it is brighter in B than in V therefore its apparent magnitude B will be lower than apparent magnitude V. Colour Index is B - V so for this star it will be < 0, that is negative. This is shown in the diagram below:
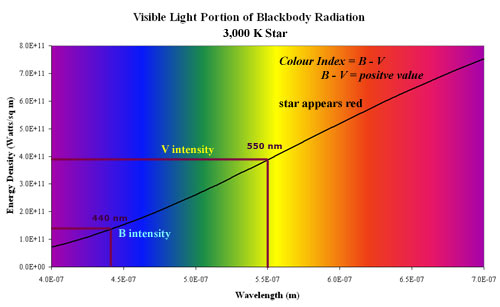
For a 3,000 K star that emits more energy at the V rather than B waveband, B - V must be > 0, that is positive. The diagram below shows this:
The calibration of the colour index scale means that a star of spectral class A0 and luminosity class V (ie a main sequence star) has a colour index of 0.0. Vega, (α Lyrae) is such a star. Stars hotter than Vega will have a negative colour index and appear more bluish. Stars with a positive colour index are cooler than Vega and will appear more yellow, orange or red. Note the "shade" of colour is an indistinct term whereas the colour index is a directly measurable value. A range of colour indexes related to spectral class are shown in table 4.4 below. Colour Index ranges from about -0.3 for an O4 V star to +2.0 for a high M-class star.
| Star | Spectral & Luminosity Class | Colour Index |
|---|---|---|
| σ Ori | O9.5 V | -0.24 |
| Achernar (α Eri) | B3 V | -0.16 |
| Vega (α Lyr) | A0 V | 0.00 |
| Procyon (α CMi) | F5 IV-V | +0.42 |
| Sun | G2 V | +0.65 |
| Aldebaran (&alpha Tau) | K5 III | +1.54 |
| Betelgeuse (α Ori) | M1 Ia | +1.85 |
Luminosity class does affect the colour index for a star so that a main sequence (V) star and a supergiant (Ia) of the same spectral class may not have have quite the same CI but this correction factor is beyond the scope of the syllabus. A table showing the colour index for main sequence (luminosity class V) stars is below:
| Spectral Class | Colour Index |
|---|---|
|
B0
|
-0.30
|
|
A0
|
0.00
|
|
F0
|
+0.30
|
|
G0
|
+0.58
|
|
K0
|
+0.81
|
|
M0
|
+1.40
|
Colour Index Problems
Example 1: Calculating Colour Index
The main sequence star τ Cet has an apparent B magnitude of +4.22 and an apparent v magnitude of 3.50. a) What is its colour index? b) What is its approximate spectral class and colour?
a) so, substituting in:
so τ Cet has a colour index of +0.72
b) By referring to Table 4.5 above we can see that τ Cet a spectral class somewhere between G0 and K0, probably in the upper region of G. In fact its actual spectral class from a catalog is G8. As a G-class star it would be yellow in colour.
Example 2: Calculating B given colour index and V.
Procyon (α CMi) has an apparent V magnitude of +0.38 and a colour index of +0.42. What would be its apparent magnitude at the B waveband?
we are given CI and V but need to find B, so rewriting 4.9 we get:
now substituting in:
so Procyon has a B magnitude of 0.80.
Filters in Astronomy
The concept of colour index is an extremely useful tool for astronomers. To determine the colour (hence also the effective temperature) of a star no longer requires them to obtain the spectrum of a star. Taking two images through different filters then measuring the apparent magnitude on each image is all that is required. Depending on the field of view of the image plate and the exposure time, many thousands of stars may appear on a single image. With modern image analysis the apparent magnitudes of all this objects can be quickly and automatically measured then used to determine the colour index and approximate temperatures of all the field stars.
In practice astronomers are interested in measuring brightness at more than two wavebands, B and V. The B waveband developed from a desire to measure the brightness of objects at the peak sensitivity of photographic film whilst the V waveband approximates the spectral response of human vision. By measuring brightness at even more wavebands we can fix more points along a star's spectral curve without actually having to take a spectrum. Virtually all imaging of celestial objects for research purposes is made by taking light that has passed though a filter. Using a filter of known spectral response allows astronomers to make accurate photometric measurements. Different filters are optimised for different parts of the electromagnetic spectrum.
If we concentrate on the visible, near infrared and near ultraviolet parts of the spectrum there are several filters commonly used by astronomers. in fact several different systems have been developed, many for very specific projects or to match with the characteristics of new detectors. Early CCDs used for astronomy, for instance , were relatively insensitive to the far blue parts of the spectrum compared with their response at longer, redder wavelengths and thus had a different spectral response to photographic emulsions.
Filters for ultraviolet, visible and infrared observations are normally coloured glass, dyed plastic or gelatin or similar that only allow a narrow waveband, typically about 100 nm wide, of radiation through. Other types of optical filters use interference to produce very narrowband filters where the waveband may only be a few nanometers wide. One example is the H-$alpha filter that peaks at 652 nm. It is used for solar observations and .
The Johnson system is a standard one that uses five filters, U, B, V, R and I that have peak responses in the ultraviolet, blue, yellow-green, red and near infrared parts of the spectrum respectively. A plot showing the spectral response of the Johnson series of filters is below. It actually shows a modified form developed by M. Bessel.
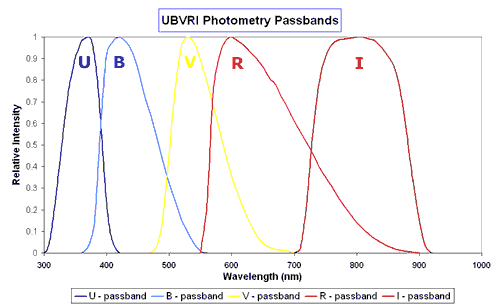
The peak wavelengths for the the filters under the standard Johnson UBVRI system are tabulated below:
| Filter | Peak Wavelength for Maximum Transmission (nm) |
|---|---|
|
U
|
365
|
|
B
|
440
|
|
V
|
550
|
|
R
|
700
|
|
I
|
900
|
An example comparison of stellar images through different filters is shown below. The central star in each image is R Canis Minor (R CMi), a very red carbon star of C7 spectral class. Note how it appears much brighter through the red filter than the blue filter. The spikes surrounding it at not "real", that is they are not actually part of the star. they are diffraction spikes caused by the light bright light from the point source stars diffracting on the telescope optics. Similarly the halo around R CMi in the red frame is caused by photochemical processes when the original photographic plate is exposed to bright point sources. Halos and diffraction spikes are examples of artefacts.
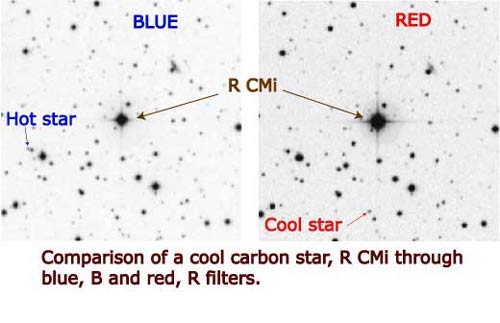
Two other stars have been highlighted in the fields above. See how the hot star is visible in the blue plate but much fainter in the red. The cool star is more prominent on the red plate than the blue.
Filters are also used at other wavebands in the em spectrum. Radio telescopes use electrical filters where the attenuation of a signal varies with frequency. As with optical-type filters they can be optimised to allow a wide or limited range of frequencies through.

