|
ATNF Pulsar Catalogue Tutorial Pages: Introduction 1: The simplest query 2: Using the standard parameter set 3: Defining your own display parameters 4: Sorting 5: Conditional logic statements 6: Filtering on pulsar names 7: Finding pulsars within a circular region 8: Formatting the output 9: Obtaining the plotted output 10: Playing with the applet 11: Using the expert parameters |
Plotting Applet Page 10: Playing with the applet On the assumption that you now have the plot applet up, we can start playing with the functionality. This plot is written in Java and is fully interactive. First thing to try is drawing a box on the plot. So click and drag you mouse anywhere on the plot. Notice that there is a list of pulsar names that are continuously changing. This list contains all the pulsars that are bounded by the boxed region that you specify. It changes dynamically with everytime you draw a new region. The origin There are also a pair of grey lines extending from one end of the plot to the other for each axis. These are the lines to indicate the origin. Pulsar types There are different shapes and colours for different types of pulsars. The different shapes make sure that those who are colour-blind or who can only print in black and white can still notice the different types. The legend is located on the top right of the applet. Identifying each point Now, draw a box over a few points (by a few, I mean make sure that you can see each of the points clearly and not a large blob of colour where the points are indistinguishable). Move you mouse over to the list on the lower right hand side of the applet and just click on a few of the items in the list (the pulsar names). Notice what happens? A set of cross hairs appear inside the region you have drawn to accurately point out which pulsar you are referring to. The coordinates also appear underneath this list. This can help you with accurately identifying the X and Y values of each pulsar. Below is an example of all the activities mentioned. Of course, yours is probably different to this example. 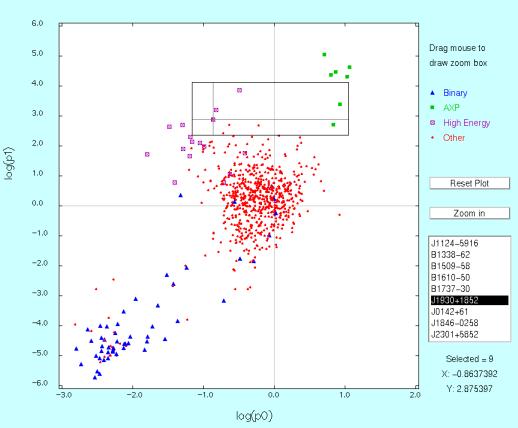
Zooming in This box also identifies your zoom region. That is, what you see in the box is what you will see when you click on zoom in, except it is scaled to fit exactly into the dimensions of the plot. So, now, click on the "Zoom in" button to the right. This is the result after clicking on "Zoom in" for the box drawn out above. 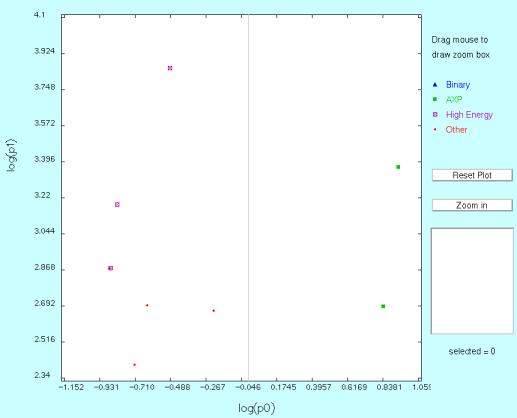 And then, to reset it to its initial plot, just click on "Reset Plot". Click on the back button to go back to the main form ready for the next lesson which focusses on the Expert Mode. next page >> |
This loads a font easier to read for people with dyslexia.
This renders the document in high contrast mode.
This renders the document as white on black
This can help those with trouble processing rapid screen movements.