Radio Continuum Images of the Small Magellanic Cloud
4.8 & 8.6 GHz
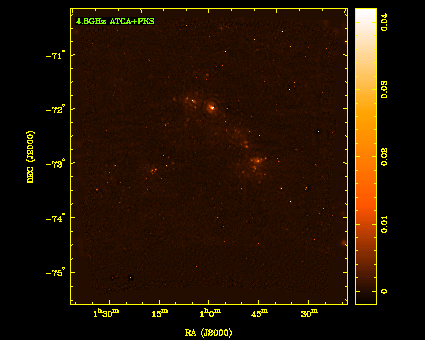
Observations by J.Dickel, R.Gruendl, V.McIntyre, S.Amy (2005, 2006).
The project was intended to gather a data set with uniform uv-plane coverage, to produce images with sufficient spatial resolution and sensitivity to identify most of the SNRs and HII regions, and (together with Parkes observations) give a good representation of the smooth emission within the galaxy. The 6km antenna was included to allow discrimination of point sources.
| Images | ||
| File | Frequency | Description |
|---|---|---|
| SMC4.8-i.a.fits | 4.8GHz | Total intensity image, ATCA only |
| SMC4.8-i.f.fits | 4.8GHz | Total intensity, ATCA only, match-filtered |
| SMC4.8-i.m.fits | 4.8GHz | Total intensity, ATCA+Parkes |
| SMC4.8-p.a.fits | 4.8GHz | Polarized intensity image, ATCA only |
| SMC4.8-p.f.fits | 4.8GHz | Polarized intensity, ATCA only, match-filtered |
| SMC4.8-pa.a.fits | 4.8GHz | E-vector polzn angle image, ATCA only |
| SMC4.8-pa.f.fits | 4.8GHz | E-vector polzn angle, ATCA only, match-filtered |
| SMC4.8-q.a.fits | 4.8GHz | Stokes Q image, ATCA only |
| SMC4.8-q.f.fits | 4.8GHz | Stokes Q, ATCA only, match-filtered |
| SMC4.8-u.a.fits | 4.8GHz | Stokes U image, ATCA only |
| SMC4.8-u.f.fits | 4.8GHz | Stokes U, ATCA only, match-filtered |
| SMC8.6-i.a.fits | 8.6GHz | Total intensity image, ATCA only |
| SMC8.6-i.m.fits | 8.6GHz | Total intensity, ATCA+Parkes |
| SMC8.6-i.m.c.fits | 8.6GHz | Total intensity, ATCA+Parkes, convolved |
| SMC8.6-p.a.fits | 8.6GHz | Polarized intensity image, ATCA only |
| SMC8.6-p.c.fits | 8.6GHz | Polarized intensity, ATCA only, convolved |
| SMC8.6-pa.a.fits | 8.6GHz | E-vector polzn angle image, ATCA only |
| SMC8.6-pa.c.fits | 8.6GHz | E-vector polzn angle image, ATCA only, convolved |
| SMC8.6-q.a.fits | 8.6GHz | Stokes Q image, ATCA only |
| SMC8.6-q.c.fits | 8.6GHz | Stokes Q, ATCA only, convolved |
| SMC8.6-u.a.fits | 8.6GHz | Stokes U image, ATCA only |
| SMC8.6-u.c.fits | 8.6GHz | Stokes U, ATCA only, convolved |
| Visibility data | ||
| File | Frequency | Description |
| SMC4.8_A-uv.fits | 4.8GHz | Subfield A, calibrated visibility data |
| SMC4.8_B-uv.fits | 4.8GHz | Subfield B, calibrated visibility data |
| SMC4.8_C-uv.fits | 4.8GHz | Subfield C, calibrated visibility data |
| SMC4.8_D-uv.fits | 4.8GHz | Subfield D, calibrated visibility data |
| SMC4.8_E-uv.fits | 4.8GHz | Subfield E, calibrated visibility data |
| SMC4.8_F-uv.fits | 4.8GHz | Subfield F, calibrated visibility data |
| SMC4.8_G-uv.fits | 4.8GHz | Subfield G, calibrated visibility data |
| SMC4.8_H-uv.fits | 4.8GHz | Subfield H, calibrated visibility data |
| SMC4.8_I-uv.fits | 4.8GHz | Subfield I, calibrated visibility data |
| SMC8.6_A-uv.fits | 8.6GHz | Subfield A, calibrated visibility data |
| SMC8.6_B-uv.fits | 8.6GHz | Subfield B, calibrated visibility data |
| SMC8.6_C-uv.fits | 8.6GHz | Subfield C, calibrated visibility data |
| SMC8.6_D-uv.fits | 8.6GHz | Subfield D, calibrated visibility data |
| SMC8.6_E-uv.fits | 8.6GHz | Subfield E, calibrated visibility data |
| SMC8.6_F-uv.fits | 8.6GHz | Subfield F, calibrated visibility data |
| SMC8.6_G-uv.fits | 8.6GHz | Subfield G, calibrated visibility data |
| SMC8.6_H-uv.fits | 8.6GHz | Subfield H, calibrated visibility data |
| SMC8.6_I-uv.fits | 8.6GHz | Subfield I, calibrated visibility data |
| README | Brief description of the files and the project. | |
| MD5SUMS | md5 checksums of the data files | |
The visibility data have been grouped into sets of pointings centered on the locations tabulated below. For full fidelity, all the visibility data should be used to generate images. However for small fields of interest one should be able to use the visibility data for just the relevant subfield.
| Field ID | Field Name | Field Centre (J2000) | |
|---|---|---|---|
| RA | Dec | ||
| A | n | 00:59:56.9 | -71:27:32 |
| B | se | 01:21:52.5 | -74:37:50 |
| C | s | 00:59:56.2 | -74:42:08 |
| D | sw | 00:37:58.8 | -74:37:47 |
| E | e | 01:19:51.2 | -73:01:24 |
| F | c | 00:59:56.6 | -73:05:20 |
| G | w | 00:40:01.0 | -73:01:21 |
| H | ne | 01:18:10.0 | -71:23:54 |
| I | nw | 00:41:42.7 | -71:23:51 |
| Freq (GHz) |
FWHM (arcsec) |
rms (mJy.bm-1) |
|---|---|---|
| 4.8 | 35 | 0.5 |
| 8.6 | 22 | 0.5 |
The 'match-filtered' images have been constructed from a subset of the uv-data; the long spacings at 8.6 GHz and the short spacings at 4.8 GHz have been excluded to give the same range of spatial frequency response at both freqencies.