Types of Binary Stars
As has already been mentioned, binary stars are generally classified according to their method of detection. These types are discussed in detail below:
Visual Binaries
A visual binary is a binary system in which the component stars of the system can be individually resolved through a telescope. Long-term observations can then be made to plot the relative positions of the members of the system. Over time this data is accumulated and used to calculate the orbits of the stars.
Visual binaries tend to be systems that are relatively close to us so that the individual stars can be resolved. They are systems in which the component stars are also physically widely separated, tens to a few hundred AUs. The stars in such systems are gravitationally bound to each other but otherwise do not "interact" as do other close binaries where one star may draw material off the surface of the other. The brightest component in the system has the suffix "A", the next "B" and so on. Systems with three or four components have been identified. Less than 1,000 visual binary systems have been detected.
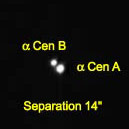
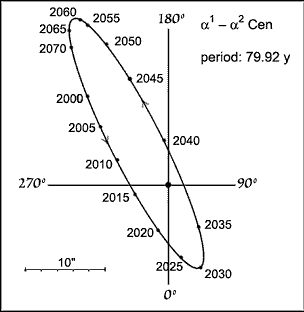
Many prominent stars in our night sky are in fact visual binary systems. α Centauri, 1.338 pc distant is in fact a visual binary with the two stars labelled α Cen A and α Cen B separated by a distance of about 23 Astronomical Units, slightly greater than the distance between Uranus and the Sun. They orbit each other with a period of 80 years. A third star, Proxima Cen, currently the closest star to us at a distance of 4.22 ly or 1.295 pc is also called α Cen C. For many years since its discovery in 1915 it was thought to be a third member of the system at a much greater distance from the system's centre of mass. Recent observations, however, suggest it may not be gravitationally bound to the other two.
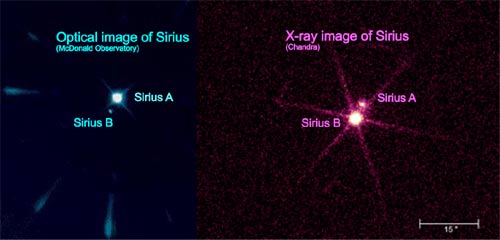
Another nearby visual binary system is Sirius in the constellation Canis Major. Of the two stars, α CMa A is an A1 V star, the brightest in the night sky with an apparent magnitude of -1.43. Its companion star, α CMa B is a much dimmer star. In fact it is a white dwarf with an apparent magnitude of 8.44. This system was first detected as binary by astrometry and the white dwarf was not visually detected until 1862.
Examples of visual binaries in the southern skies resolvable through small telescopes include α Crucis, β Crucis and γ Cen and Castor in Gemini.
Some stars appear close together when viewed through a telescope but in fact are not gravitationally bound and can be hundreds of parsecs or more apart. Such line-of-sight pairs are called "optical pairs" and are not true binaries.
Spectroscopic Binaries
Most binary systems are too distant to be resolved as visuals by current telescopes. Others are simply too close together to be resolved separately. How then can they be detected as binaries? The majority of binary systems have been detected by Doppler shifts in their spectral lines. Such systems are called spectroscopic binaries.
If a binary system is unresolved into its components then the spectrum obtained from it will actually be a combination of the spectra from each of the component stars. As these stars orbit each other one star, A, may be moving towards us whilst the other, B, may be moving away. The spectrum from A will therefore be blue-shifted to higher frequencies (shorter wavelengths) whilst B's spectrum will be redshifted. If the stars are moving across our line of sight then no Doppler shifting occurs so the lines stay in their mean positions. As the stars continue orbiting, A will recede so its spectral lines will move towards the red end of the spectrum and B's will move toward the blue. This is shown schematically in the diagram below.
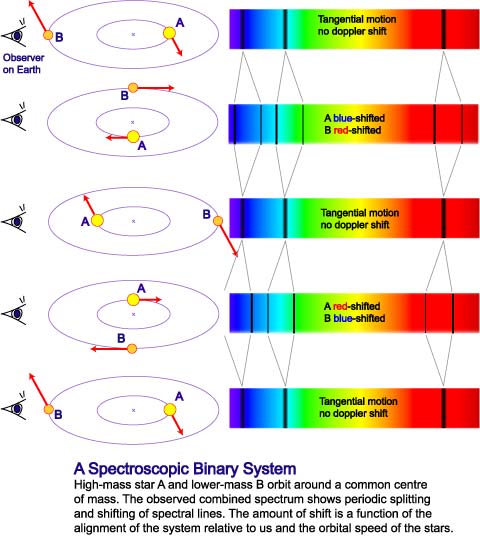
Obviously the ability to detect a binary spectroscopically depends upon a few factors. Firstly if the orbital plane of the system its at right angles to our line-of-sight then we will not observe any Doppler shift. The system will not then be detected as a binary. If the component stars are low in mass and/or far apart then the period will be long and the orbital velocities low, reducing the chance of detection. In some systems one of the components is too dim to contribute much to the combined spectrum so that only one set of lines shows periodic shifts.
Analysis of the spectral line shifts versus time reveals information about the radial velocities of the component stars.
In spectroscopic binaries the component stars are often very close and may in fact exchange material due to tidal interactions. Orbital periods range from a few hours to months, with separations of much less than an AU in many cases.
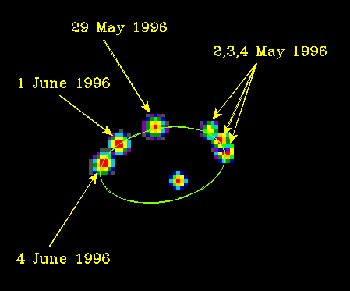
The first spectroscopic system discovered was Mizar or ζ Ursae Majoris in 1889. Actually Mizar was already known as a visual binary but spectroscopic analysis of the brighter of the two stars, Mizar A, showed that it was in fact a spectroscopic binary. Subsequent observations revealed that Mizar B was also a spectroscopic binary thus the whole system comprised four stars. With recent improvements in optical interferometry and imaging techniques, modern astronomers can now "split" or resolve Mizar A into its component stars as is shown in the image below.
Eclipsing Binaries
The third method of detecting a binary system depends upon photometric measurement. Many stars show a periodic change in their apparent magnitude. This can be due to two main reasons. It could be a single star that undergoes a change in its intrinsic luminosity. Such stars are called pulsating variables and are discussed in another page in this section. The second possibility is that it is in fact a binary system in which the orbital plane lies edge-on to us so that the component stars periodically eclipse one another. These systems are called eclipsing binaries.
There are a few thousand such systems known, most of which are also spectroscopic binaries. A few are also visual binaries. The first eclipsing binary detected was Algol, β Perseus, also known as the Demon star possibly due to its changing brightness. As with spectroscopic binaries, the two stars in an eclipsing system are physically close and are often distorted by each other. Mass can be transferred from one star to the other, resulting in what is sometimes referred to as the "Algol paradox".
The picture below shows an artist's impression of such an accreting system. here the gas in the envelope of the blue giant is being drawn off by its compact companion. The material forms a flattened accretion disk. As it falls towards the compact companion it gets accelerated and heats up, producing X-rays and γ-rays as it falls onto the star.

A light curve must be obtained in order to classify a system as an eclipsing binary. This is simply a plot of apparent magnitude over time. Light curves are often displayed as "folded" where phase rather than a specific date or time unit is displayed on the horizontal axis. The diagram below is a folded light curve from the Hipparcos database. The periods of most eclipsing binaries are a few hours or days.
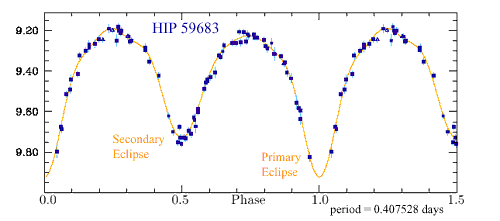
Eclipsing binary light curves are characterised by periodic dips in brightness that occur whenever one of the components is eclipsed. Unless the two stars are identical, one of the eclipses, called the primary eclipse, is likely to result in a greater drop in brightness than the other, secondary eclipse. One period of a binary system therefore has two minima. Why will one eclipse cause a greater drop in light than the other? Consider the situation below. It shows a simulated light curve for the system SV Cam.

As you can see in SV Cam, star 1 is hotter than star 2. According to Stefan's Law this means that it radiates more energy per unit surface area than the cooler star 2 (remember, L ∝ T4 ). Thus when star 1 passes behind (ie is eclipsed by) star 2, more flux is blocked then when star 2 is eclipsed by star 1. The primary eclipse therefore always occurs when the hotter of the two stars is eclipsed. Secondary eclipses occur when the hotter star passes in front of the cooler star.
Analysis of the light curve may allow astronomers to determine the eccentricity, orientation and inclination of the orbit. The radii of the stars relative to the orbit size can be measured by the time it takes each eclipse to occur (the slope on each of the minima curves). The ratio of effective temperatures of the two stars can also be calculated.
You can model the light curves of eclipsing binaries using computer simulations on another page.
Astrometric Binaries
Some stars, if observed repeatedly over time, show a perturbation or "wobble" in their proper motion. If this is a periodic occurrence we can infer that the perturbation occurs due to the gravitational influence of an unseen companion. We have a system in which a visible star and a dimmer companion orbit a common centre of mass. Binary systems detected by such astrometric means are called astrometric binaries.
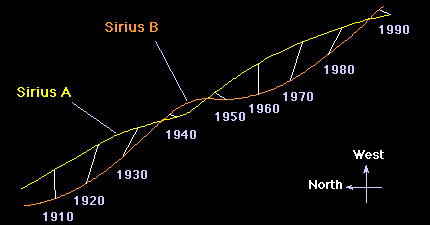
Relatively few binaries have been detected astrometrically primarily due to the need for long-term observations and the uncertainty in position and proper motion measurements. This will no doubt change though with the next generation of space-based astrometric missions. The best known example of an astrometric binary is Sirius. In 1844 Friedrich Bessell pointed out that it had a wobble in its proper motion. From this he inferred that the visible star, now called Sirius A must have an unseen (hence dim) companion, Sirius B. This was only seen telescopically by Alvan Clark in 1862 and is now known to be a dim white dwarf. Procyon, Α Canis Minoris, was another star first detected as an astrometric binary. It too has a white dwarf companion that can now be observed telescopically.
"Exotic" Types
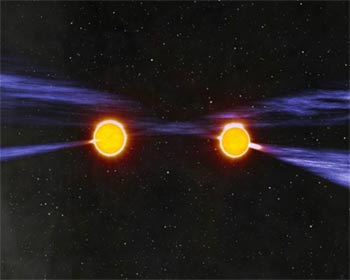
One of the most exciting celestial objects discovered in late 2003 on the Parkes radio telescope is the first-known binary pulsar, PSR J0737-3039. It has a 23-millisecond pulsar PSR J0737-3039A and another pulsar, PSR J0737-3039B that rotates once every 2.8 seconds orbiting each other with a period of just 2.4 hours. This exotic system has excited astronomers around the world as it is an amazing test bed for General Relativity and the search for gravity waves. Not only is it the first such system detected but it is even an eclipsing binary. The relativistic effects on the orbit however mean that this it is only likely to remain inclined on an eclipsing orbit for another ten years or so.
For more details about this system, view the press release. To find out more about pulsars visit our introduction to pulsars page.

