Information from Astronomical Spectra
The key point to remember about astronomical spectra is that they provide astronomers with a wealth of detail about the physical characteristics, motion and composition of objects. In this section we will examine what information can be obtained from spectra and how this is done.
- Effective (Surface) Temperature and Wien's Law
- The Doppler Effect
- Translational Motion
- Rotational Motion
- Stellar Density and Pressure Broadening
- Chemical Composition
- Other Information
Effective Surface Temperature and Wien's Law
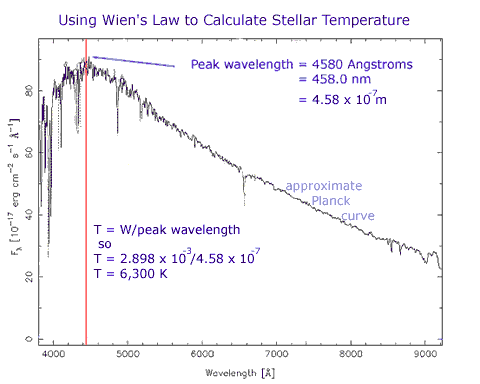
As we have already seen, the behaviour of most stars approximates that of black body radiators. This means that they emit some energy at each wavelength but also have a peak wavelength and region in which they emit most of their energy. In the early 1890s Wilhelm Wien investigated thermodynamics and coined the term black body for an ideal radiator. He discovered that the wavelength of maximum energy emitted from a perfect black body was inversely proportional to the temperature of the body, λmax is proportional to 1/T. This relationship is known as Wien's Law in his honour.

Equation 1: Wien's Law, where λmax is the peak wavelength, T is the effective temperature of the black body and W is a constant called Wien's Constant and has a value of 2.898 x 10⁻³ for λmax in meters and T in kelvins.
(Note: This equation is not explicitly required for the NSW HSC course)
Wien's Law is a highly significant relationship. He used it to estimate the effective temperature of the Sun at 6,000 K which was much closer than the previous estimate of 10,000 K predicted using the Stefan-Boltzmann law of radiation. The value of Wien's relationship is that if you can measure the wavelength of maximum intensity from a spectrum, you can use it to calculate a value for the effective temperature. let us see how this works in the example below. Remember, this is an actual stellar spectrum so it approximates a black body and has absorption lines in it rather than being a perfect continuum Planck curve.

Astronomers can determine the effective temperature of a star simply be taking its spectrum.
The Doppler Effect
The Doppler effect refers to the apparent shift in the wavelength (and frequency) of a wave when there is relative motion between the source or emitter of the wave and an observer. A common example of this effect is the sound made by a passing ambulance. As the ambulance approaches you the sound waves are apparently shifted to a shorter wavelength (hence higher frequency). You perceive this increased frequency as a higher-pitched sound. Once the ambulance passes you it is now receding from you so the sound waves are shifted to a longer wavelength and lower frequency. You hear this as a lower pitched sound.
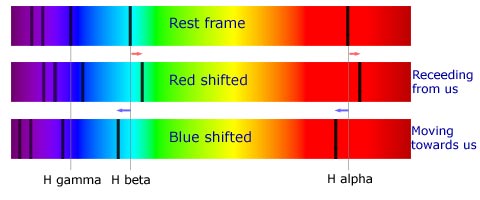
When discussing electromagnetic waves we use the term Doppler shift to describe this effect. If we obtain a spectrum from an object at rest to us then there is no Doppler shift in the spectrum. The spectral lines for the Balmer series, for instance, would appear at the same wavelengths as those from a hydrogen discharge tube in the laboratory or observatory. No relative motion therefore no apparent shift in lines.
If an object such as a star was moving away from us (or indeed us from it, it is only the relative motion that is important) then the spectral lines would appear to shift towards the longer wavelength or redder part of the spectrum. Such a shift is termed a redshift. The amount of the shift would depend on the relative velocity between source and observer. The greater the recession velocity, the greater the shift in the lines.
In cases where an object is moving towards us, its spectral lines will appear to shift to the shorter wavelength, bluer part of the spectrum. This is called a blueshift. Again, the amount of blueshift will depend upon the relative velocity between source and observer. A basic diagram showing shift for a set of Balmer lines in a stellar spectrum is shown below.

If a star moves relative to an observer on Earth with a radial velocity v and emits a certain wavelength λ then the Earth-based observer will see a Doppler-shifted wavelength of λ'. These two are related by the following formula:
where c = speed of light = 3.0 x 10⁸ m.s-1 and v is non-relativistic in speed. By convention v is positive for receding objects and negative for those approaching. (note this equation is not explicitly required for NSW HSC Physics candidates).
Translational Motion
If the spectral lines in a star's spectrum are uniformly redshifted this would indicate relative recessional motion between the observer and the star. The amount of redshift would depend on the recession velocity. A complicating factor is the fact that the motion may not be directly away from us. In this case the Doppler shift of lines would depend on the component of velocity away from us, that is the star's radial velocity.
A star moving towards us would, of course, exhibit a blueshift in its spectral lines.
Rotational Motion
Even though we can still only resolve most stars as point sources they are in fact large, roughly spherical balls of hot gas and plasma. Stars rotate, that is they spin on their axis. The Sun's sidereal rotational period is about 26 days on the solar equator and possibly up to 36 days at the poles. The different rates is due to the fact that it is not a solid sphere and the gas and plasma can rotate at different speeds.
If we obtain a spectrum from a distant star that is rotating in the same plane as us then the light gathered is a combination of light from across the disc of the star. As part of the star appears to rotate towards us its light will be blueshifted. The light from the part of the star rotating away from us will be redshifted. The section in the middle of the disc that is moving tangentially to us will not exhibit Doppler-shift.
What effect will this have on the star's spectrum?
The net effect is that the star's spectral lines will appear smeared out. This broadening of lines can be distinguished from the effects of pressure broadening due to stellar pressure discussed in the next section. The beauty of rotational broadening is that it can be used to measure the rotation rate of stars. As with translational velocity the alignment of the plane of rotation of the star with Earth is a factor and must be calculated from the spectrum.
Stellar Density and Pressure Broadening
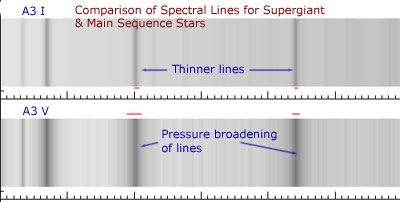
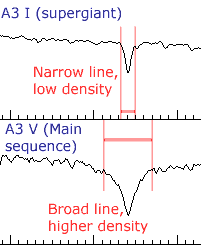
In attempting to classify stars using their spectral characteristics astronomers faced a problem with some stars. Two stars may appear to have the same lines but one of them shows broader lines than the other in a photographic spectrum. Are they then the same spectral class? This question was resolved when the spectral data was combined with the information about the luminosity some stars that had been obtained separately. A photographic example for A3-class stars is shown below.

For a given temperature, the more luminous the star was, the narrower the spectral lines were. The width of the line (and the depth for an intensity plot) provides information about the outer layers of the star, the region in which the absorption of photons from the core occurs. Large stars have a very low relative density in their outer layers as the volume occupied by a given mass of gas is much greater.

Chemical Composition and Metallicity
The presence of a spectral line corresponding to a specific energy transition for an ion, element or molecule in the spectrum of a star indicates that the specific ion, atom or molecule is present in that star. This is a fairly obvious statement but one with great importance for astronomers. This was how helium was first discovered in the Sun before it was isolated on Earth. We now know that stars are mostly made up of hydrogen and helium, with small amounts of some other elements. This is only known due to spectroscopy.
A key point to remember, however, is that the absence of a spectral line does not also necessarily mean that that element is not present in that star. it simply means that the conditions in the layers of the star responsible for absorption and emission lines are not conducive to the formation of that specific transition or line.
Modern spectroscopy is highly efficient and is often conducted with very high resolution spectrographs that show spectral lines in fine detail. Astronomers can not only detect the presence of a line but they are often able to determine the relative amounts of different elements and molecules present. They can thus determine the metallicity of a star. In astronomy the term metal historically has been applied to any element heavier than helium so that even elements such as carbon and oxygen are called metals. When discussing metallicity then astronomers are actually talking about the relative chemical composition of a star. Stars with a higher proportion of metals are said to have higher metallicities. Why stars vary in metallicity will be discussed in the section on stellar evolution.
Other Information
Astronomers can deduce even more about a star from its spectrum. Some of these are:
- Spectroscopic binaries: Some stars show a periodic splitting and recombination of spectral lines. This is caused by the fact that what we see as one star is in fact two stars orbiting each other as a close binary pair. Binary stars discovered by their spectra are termed spectroscopic binaries. Most binaries are discovered by this method. They are discussed in detail in later section.
- Helioseismology: The Sun vibrates much like a struck bell. As sections of its atmosphere pulse in an out the spectral lines produced from the emitted light show slight fluctuations. We can now measure variations on the Sun's surface of the order of a few cm.s-1. This information is used to compile harmonic oscillation modes for the Sun which provides details about the solar interior in much the same way as we use seismic waves to probe the Earth's interior. This technique, termed helioseismology is now also used to study other stars. As the sensitivity of instruments improved and the amount of data gathered increases astronomers are able to refine their models of processes that occur inside stars.
- Exoplanets: The first planet discovered orbiting a sun-like star was in 1995 when two Swiss astronomers detected a Jupiter-mass planet around the star 51 Pegasi. This followed the discovery of a planet orbiting a pulsar the previous year. Since then over 120 planets beyond our Solar System or exoplanets have been found. The bulk of these have been detected using a method known as the Doppler wobble in which the planet's mass causes slight shifts in the spectral lines from the star. As an unseen planet moves away from us when orbiting its parent star, it causes its light to be slightly redshifted. When the planet moves towards us the star's light is blueshifted slightly. Jupiter causes the Sun to wobble with a velocity of about 12 m.s-1.
Australian astronomers are actively involved in the search for exoplanets via the Anglo-Australian Planet Search that uses the AAT. It is observing 200 nearby solar-type stars brighter than V<7.5 and relies on the Doppler wobble technique for detection. The precision of the team's method currently stands at about 3 m.s-1.
