|
The ATCA Cosmic Microwave Background Radiation Anisotropy ExperimentResultsLatest ResultsDuring July 1997 we have observed six more fields to a sensitivity of about 22-25 microJy per beams of 2-arcmin FWHM. We have analysed these fields to
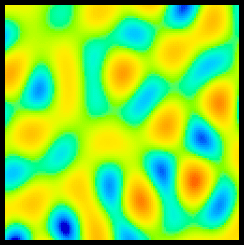
This time round we have made a careful estimation on the residual confusion in the fields due to foreground synchrotron discrete sources. We are convinced that significant (compared to the thermal noise) HOLES are caused in the images as a result of weak unsubtracted confusion!!! Our simulations show that one-in-a-few images are expected to have these spurious holes. We made observations, with offset pointing, of a field that showed a hole and are convinced that it was spurious and perhaps due to weak confusion that changed when the pointing changed. RESULTS: Within the sensitivity of our latest observations, we have no reason to believe that there are any Sunyaev-Zeldovich holes in the microwave sky surveyed. Assuming Gaussian-form CMB anisotropy with a `flat' spectrum, we derive 95 per cent confidence upper limits of Q_flat An Australia Telescope survey for CMB anisotropies, R. Subrahmanyan, M. J. Kesteven, R. D. Ekers, M. Sinclair, & J. Silk, 2000, accepted for publication in MNRAS . Earlier ResultsA single field was observed in 1991 July and December; high surface brightness images were constructed of this field (using the four 31-m baselines) with rms thermal noise of 33 microJy per beam of size 2 arcmin FWHM, the corresponding rms brightness sensitivity is 36 microK. The image showed no `excess' variance above that expected from the telescope thermal noise and was used to place an upper limit to CMB anisotropy on arcmin scales. Subrahmanyan, Ekers, Sinclair & Silk 1993, MNRAS, v.263, p.416. Following the improvement in the ATCA sensitivity (owing to the replacement of the 3-cm FETs with HEMTs), we continued our search to deeper levels making ATCA observations during 1994 October and 1995 March. The field has now been observed with an rms thermal noise of 23 microJy/beam. We have modelled (using the 61-m spacing visibilities) and subtracted the discrete-source confusion in the data and constructed residual images of high surface brightness using the 31-m spacings alone. The residual image is shown in the figure below.
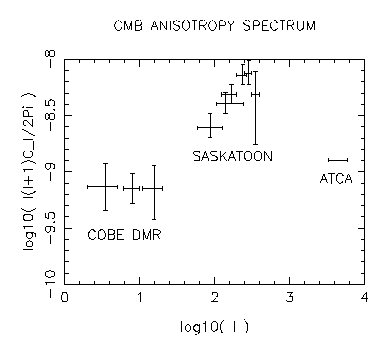
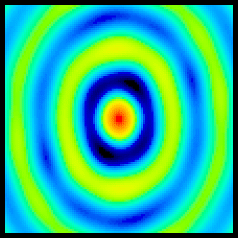
These are the residual image and telescope beam. The images are 18 arcmin across; note that the telescope primary beam that decides the f.o.v. of the telescope has a first null at 7 arcmin radius. The residual FLD1 is consistent with the expected thermal noise of 23 microJy/beam. If we assume that the CMBR anisotropy spectrum is flat (l(l+1)Cl is assumed constant in multipole l space) and normalized by the quadrupole amplitude Qflat, the likelihood ratio test places a 95 per cent confidence upper limit of 23.6 microK on Qflat (the test has a power of 0.5). Subrahmanyan, Kesteven, Ekers, Sinclair & Silk 1998, MNRAS, vol. 298, p.1189. We have now extended our survey to six distinct `empty fields' The six well-separated regions were observed at a frequency of 8.7 GHz and the survey regions were limited by the ATCA primary beams which have a full width at half maximum of 6 arcmin at this frequency; all fields were observed with a resolution of 2 arcmin and an rms thermal noise of 24 microJy/beam. After subtracting foreground confusion detected in higher resolution images of the fields, residual fluctuations in Stokes I images are consistent with the expectations from thermal noise and weaker (unidentified) foreground sources; the Stokes Q and U images are consistent with expectations from thermal noise. Within the sensitivity of our latest observations, we have no reason to believe that there are any Sunyaev-Zeldovich holes in the microwave sky surveyed. Assuming Gaussian-form CMB anisotropy with a `flat' spectrum, we derive 95 per cent confidence upper limits of Q_flat An Australia Telescope survey for CMB anisotropies, R. Subrahmanyan, M. J. Kesteven, R. D. Ekers, M. Sinclair, & J. Silk, 2000, accepted for publication in MNRAS . The COBE detections correspond to Qflat = 18 microK over l = 2-40, the Saskatoon detections confirm that the anisotropy spectrum rises to levels corresponding to Qflat = 60 microK at l = 200-300; the ATCA result that Qflat l = 3350-6050 clearly confirms the turn over in the anisotropy spectral power at large l. These observations are compared in the following figure.
 ATCA Filter FunctionConvolve your favourite CMB power spectrum with the ATCA filter function to compute the variance expected in the ATCA image. |


