The Delta Quadrant Survey
|
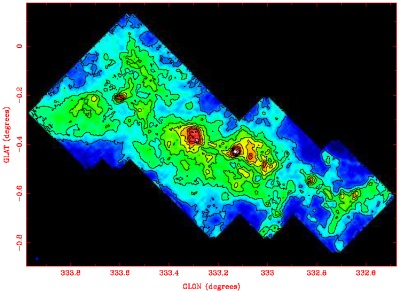
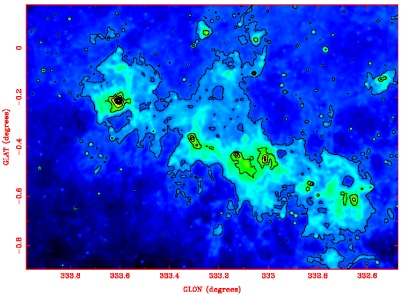
I. Bains (University of New South Wales); T. Wong (ATNF / University of New South Wales) and the Delta Quadrant Survey Team A comprehensive model that explains how stars form remains elusive to astronomers. It is generally accepted that the gas and dust in molecular clouds collapse to form a gravitationally-bound nascent stellar system, but what causes and regulates this collapse? In recent years, a potentially comprehensive model of star formation has arisen that focuses on the role played by turbulence in driving and regulating stellar birth. The precise origin of the turbulence is unknown but may arise due to large-scale gas flows or expanding supernova bubbles. The models detail how the turbulence cascades across a wide range of spatial scales and can both encourage the formation of clumps in molecular clouds and disrupt any already-forming clumps. Hence it can both drive and regulate the rate of star birth. In order to provide observational constraints for this promising theory, the Delta Quadrant Survey Team has developed a program of molecular spectral line observations, with the Mopra telescope, of an approximately one degree square region of a giant molecular cloud complex situated in the fourth quadrant (hence "Delta Quadrant") of our Galaxy, near the HII region RCW 106. The purpose of this program is to characterise the turbulence in the molecular cloud and compare it to the star forming efficiency in order to elucidate the link between the two. The program began in 2004, with 10 weeks spent mapping the molecular cloud in the 13CO (J = 1-0) transition at 110 GHz. This project was made possible by the recent development of "On-the-Fly" (OTF) mapping at Mopra. In this mode, the telescope takes data continuously while scanning across the sky, and accurate coordinate information is written into the datafile with each spectrum. Not only does OTF mapping help to smooth out systematic errors such as in pointing, but it also provides a net gain in efficiency because a single reference spectrum can be applied to multiple source spectra, as the effective on-source integration time is very short. Processing OTF data with the Parkes multibeam software is straightforward and allows data cubes to be efficiently generated. Figure 1 shows the total intensity map of the 13CO emission, while Figure 2 shows the 8-micron dust emission imaged by the Midcourse Space Experiment (MSX) satellite over the same region. The 8-micron emission is probably due largely to complex organic molecules (known as PAH's) which are excited by the radiation from newly formed stars, and thus should serve as a rough proxy for recent star formation. Note that although there is a clear correspondence between the gas peaks and the regions of recent star formation, the 13CO emission tends to be more extended and to show a more clumpy structure. The Mopra data are being used to analyse the structure of the 13CO emission using several techniques, including power spectrum, wavelet, and clump-finding methods. This analysis will then be extended to velocity correlations in order to fully characterise the properties of the turbulence. In 2005, the team will begin mapping parts of the region in C18O, a more optically thin isotopomer of CO, in order to obtain better column density information. The Spitzer GLIMPSE survey of the region will be used to obtain the stellar census and this can be compared with the molecular gas content to obtain the local star forming efficiency. In this way it will be possible to investigate the relationship between turbulence and star forming efficiency across a region roughly 100 pc in size. |
|