Temperature maps of dense molecular gas in starburst galaxies
|
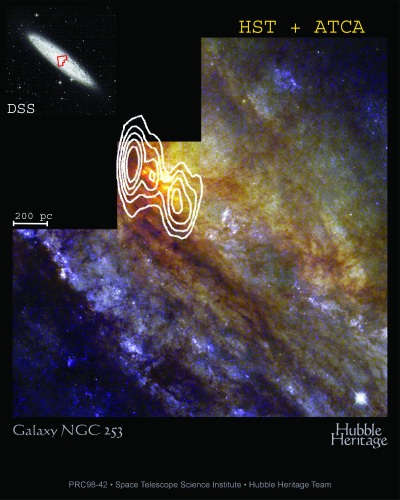
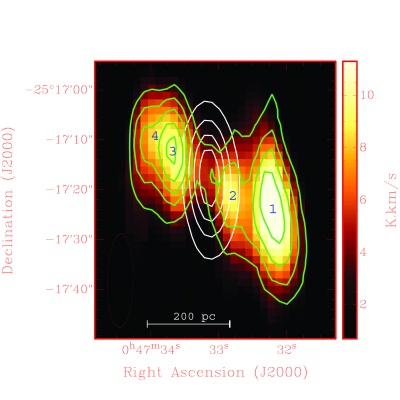
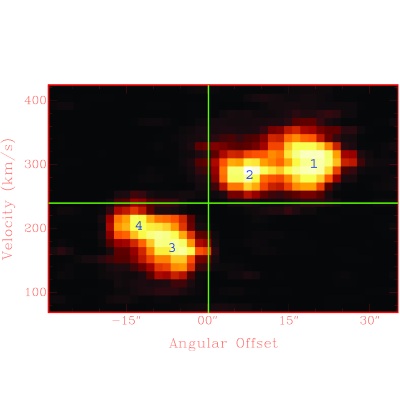
J. Ott (ATNF); A. Weiss (Instituto de Radioastronomía Milimétrica; Spain); C. Henkel (Max Planck Institut für Radioastronomie, Germany); F. Walter (National Radio Astronomy Observatory, USA) (ATNF) The new 12-mm receiver system (installed at the Compact Array in April 2003) allows astronomers, for the first time, to perform interferometric observations in the southern hemisphere in this important frequency range. Within this band lie the lowest transitions of the abundant ammonia (NH3) molecule. The specific tetrahedral structure of ammonia and the resulting metastable inversion lines can be used as an excellent thermometer of cold, dense, molecular gas - the material from which stars ultimately form. In an ongoing project, Ott and his collaborators are using this tool to compute temperature maps of the molecular cores of nearby starburst galaxies at the very high spectral and angular resolution provided by the Compact Array. Starburst galaxies exhibit current star formation rates of tens, and in extreme cases up to hundreds, of solar masses per year. The subsequent release of mechanical energy from massive stars, in the form of strong stellar winds and numerous supernova explosions, heats the ambient gas and drives superwinds perpendicular to the gaseous and stellar disks. The ionised material of superwinds can be traced by optical spectral lines and X-ray line and continuum emission at distances of up to tens of kiloparsecs from the galaxies themselves. The fuel for these periods of extreme star formation is provided by molecular gas which is found abundantly in the starburst cores. NGC 253 is a prominent, nearby starburst galaxy. Located at a distance of only 2.6 million parsecs, it exhibits a current star formation rate of five solar masses per year, of which 3.5 solar masses per year are concentrated in the central 200 parsecs (Figure 1). This region is surrounded by vast amounts of molecular gas (30 million solar masses) and the densest parts of it (volume densities >104 cm-3) are traced by ammonia. The brightest NH3 emission is observed at both sides of the starburst centre decreasing toward the centre itself and toward radii larger than about 200 parsecs (Figure 2). The high angular and spectral resolution of the Compact Array allows the identification of four dense molecular complexes, two on each side of the starburst core (Figures 2 and 3). The dynamics of the clumps are quite complex as is illustrated by the position-velocity diagram displayed in Figure 3. Simple models such as a ring rotating like a solid body are not in agreement with the data. Figure 4 shows a rotational temperature map of the dense molecular gas, calculated using the relative strengths of the NH3 (1,1) and (2,2) inversion lines. The temperature distribution is surprisingly variable ranging from approximately 30 Kelvin close to the starburst centre and 35 Kelvin in the south-western complexes to about 60 Kelvin in the north-eastern molecular clouds. The gas temperatures and radial temperature gradients are different on opposite sides of the starburst centre. Clump 2 is probably the closest molecular complex to the starburst centre (Figure 3) and it is surprising that this cloud has the lowest temperature. It appears that heating by the weak active galactic nucleus (AGN) or by the nuclear starburst does not dominate the heating processes in the molecular clouds. Instead, cloud 2 may be the first of the four complexes to be converted into stars and to support starburst activity. While temperatures are not consistent with a systematic trend as a function of galactocentric radius, abundances do show such a trend. The ratio of ammonia to molecular hydrogen, NH3/H2, is about 5.5x10⁻⁹ in the outer molecular complexes; the central diffuse region between clouds 2 and 3 exhibits a relative abundance of only about 2.5x10⁻⁹. This effect can be explained by the strong UV radiation of the star-forming region near cloud 2 which destroys ammonia in its vicinity. Alternatively, the high densities required for the excitation of ammonia might only be largely met in the molecular complexes but not in the more diffuse, central volume. The faint molecular gas component observed at the very starburst centre might therefore be part of the debris after preceding dense components collapsed into stars. |
|