Wavebands - Photons from Space
- Electromagnetic Spectrum
- Atmospheric Windows
- Why Observe at Different Wavebands?
- Further Information
- Questions
Relevant syllabus point:
- discuss why some wavebands can be more easily detected from space
Astronomy is primarily an observational science. Astronomers obtain information by analysing the photons gathered from distant celestial objects. These photons are normally collected in telescopes that have various types of instruments attached. From Galileo’s use of the telescope in 1609 to the Second World War, such telescopes were optical, that is they gathered photons of light in the visible part of the electromagnetic spectrum. Visible light, however, is only a small part of the much larger electromagnetic spectrum. The last fifty years has seen astronomers develop techniques to utilise the whole of the electromagnetic spectrum, from radio waves to gamma-rays.
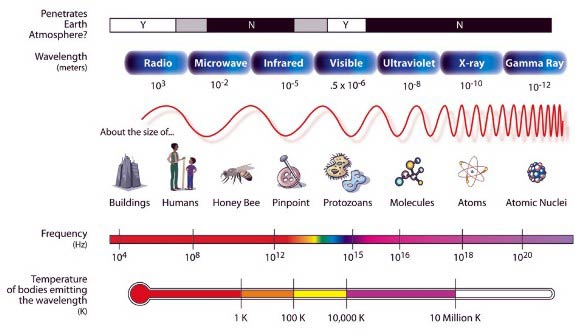
The Electromagnetic Spectrum
Visible light is but one part of the larger electromagnetic spectrum. Astronomers now utilise the whole spectrum to obtain information about celestial objects. You should already be aware that the electromagnetic spectrum is comprised of electromagnetic waves. These waves are non-mechanical and do not require a medium for propagation, that is they can travel through the vacuum of space. The contributions of Maxwell, Michelson, Morley, Einstein and others led to an understanding of the properties of em waves. Being 'waves' they obey the wave equation:
Electromagnetic waves have a constant velocity, c, in a vacuum where c ≈ 3.0 x 10⁸ m.s-1.
The energy of the wave is purely a function of its frequency, the higher the frequency, the more energetic the wave hence radio waves are less energetic than X-rays as they are lower in frequency are longer in wavelength. The energy is given by the relationship:
One implication of Planck and Einstein's work is that 'light' or electromagnetic radiation is in fact quantised. This means that is has certain discrete values and can be thought of as displaying particle-like behaviour rather than wavelike behaviour. These 'particles' or quanta of electromagnetic radiation are called photons. High energy photons correspond to light of higher frequency (and shorter wavelength).
Atmospheric 'Windows'
Our atmosphere is constantly in motion. It is a mixture of gases, water vapour, dust and other suspended particles. All these impact on the ability of a telescope to receive light and to clearly resolve an image.
The most obvious effect is that of absorption - most radiation incident on the Earth’s upper atmosphere does not reach the ground. The atmosphere is effectively opaque to all but some radio wavebands and light in the optical window. This includes the entire visible region (390 nm – 780 nm) plus the near ultraviolet, near infrared and some far infrared wavebands. Much of the infrared (21 mm to 1 mm) suffers absorption from water and carbon dioxide and oxygen molecules whilst most ultraviolet undergoes absorption by ozone. Gas atoms and molecules absorb X-rays and gamma ( γ )-rays. Whilst the atmosphere is transparent to many radio wavelengths, atmospheric absorption becomes a problem < 2 cm and the ionosphere reflects waves > few metres.
Why Observe at Different Wavebands?
We gather most information about our local environment through our eyes. Our vision utilises the visible part of the electromagnetic spectrum. This is not surprising as we have evolved on a planet surrounding a G-class star that emits most of its energy in the visible part of the spectrum, hence our eyes have evolved to be most sensitive to the wavelengths corresponding to the Sun's peak emissions. Not all objects, however, emit most of their energy at visible wavelengths.
Consider the image below. What type of object is it?
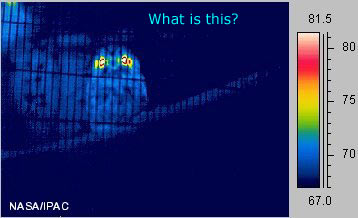

The image above was taken at infrared wavelengths so it shows warmer regions as red or white, in this case the eyes. The feathers insulate the bird so its body appears dark blue in the image. For more examples visit the Infrared Zoo at the Cool Cosmos site.
Now how does this relate to astronomy? Well, similar principles apply. Can you guess what the object below is? Click on it to find out.
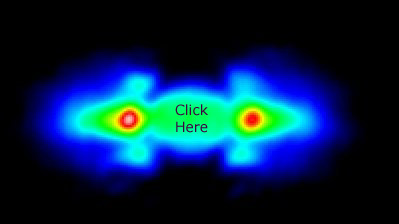
No, it is not a strange lizard. This is an image of an object at a wavelength of 22 cm, in the radio waveband. The 'green' central region is due to thermal radiation from Jupiter's atmosphere, which is faint at 22 cm (L band). The bright 'red' features beyond the disk are due to synchrotron radiation emitted by relativistic electrons trapped in Jupiter's magnetic field. This radiation is mainly concentrated along Jupiter's magnetic equator, but is also at higher magnetic latitudes as seen by the two 'horns'.
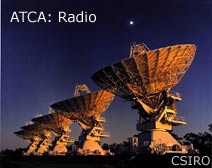
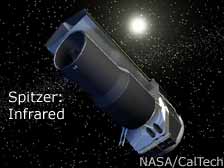
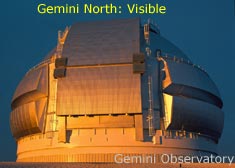
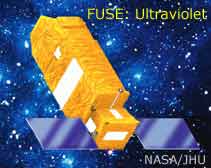
As you can see, we get different information about celestial objects by observing at different wavebands. The table below summarises the key information about the wavebands including the type of objects that produce them, examples and telescopes used to observe at these wavebands.
| Type of Radiation | Wavelength range (nm) | Frequency range (Hz) | Typical Sources | Temperature of radiating object | Examples of telescopes |
|---|---|---|---|---|---|
| Radio | > 1 x 10³ | < 3 x 10¹¹ | Interstellar medium, cool gas, electrons | < 10 K | ATCA, Parkes, |
| Infrared | 103 - 106 | 3 x 10¹¹ - 4 x 10¹⁴ | cool clouds of dust and gas; planets, | 10 - 103 K | Spitzer Space Telescope |
| Visible | 400 -700 | 4 x 10¹⁴ - 7.5 x 10¹⁴ | exterior of stars | 103 - 105 K | AAT, Gemini, HST |
| Ultraviolet | 20 - 400 | 7.5 x 10¹⁴ - 3 x 10¹⁶ | supernova remnants, very hot stars | 105 - 106 K | FUSE |
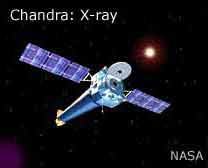
| X-ray | 0.01 - 20 | 3 x 10¹⁶ - 3 x 10¹⁹ | supernova remnants, gas in clusters of galaxies, stellar corona | 106 - 108 K | Chandra, XMM-Newton |
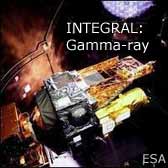
| Gamma-ray | <0.01 nm | > 3 x 10¹⁹ | hypernova, accretion disks around black holes | > 108 K | INTEGRAL, GLAST |
The important point is that different physical processes produce emissions at different wavebands. By observing at those wavebands, astrophysicists can gain an understanding of the physical conditions that exist on or near that object. Ideally, information obtained from each waveband is combined to give a fuller understanding of an object.
An example of an object at different wavebands is the active galaxy, Centaurus A (or NGC 5128). The Cool Cosmos Cen A site provides images from radio to X-ray with a description of the processes involved for producing the different types of emission. More detailed radio images of Cen A, showing the value of using interferometry to improve resolution can be found here.
Telescopes for Different Wavebands
Further Information
The Electromagnetic Spectrum is a detailed site with a range of levels by NASA's Goddard Space Flight Centre (GSFC).
The HyperPhysics Electromagnetic Spectrum page has useful diagrams that are linked to more detailed information on each waveband and an interactive applet to calculate frequencies and wavelengths for em radiation.
Multiwavelength Milky Way Education Page also from the GSFC provides images of the Milky Way at different wavebands and links to other wavelength specific resource and sites.
Cool Cosmos is an extensive NASA site that has a several pages on multiwavelength astronomy including one that shows objects within our galaxy at different wavelengths.
Observations at other Wavelengths has a concise explanation of atmospheric windows and a table of different wavebands. Also look at The Electromagnetic Spectrum at the same site.
What is Infrared Radiation? is a short page from the Gemini web site explaining what it is and how Gemini can observe it.
Questions
(coming soon)